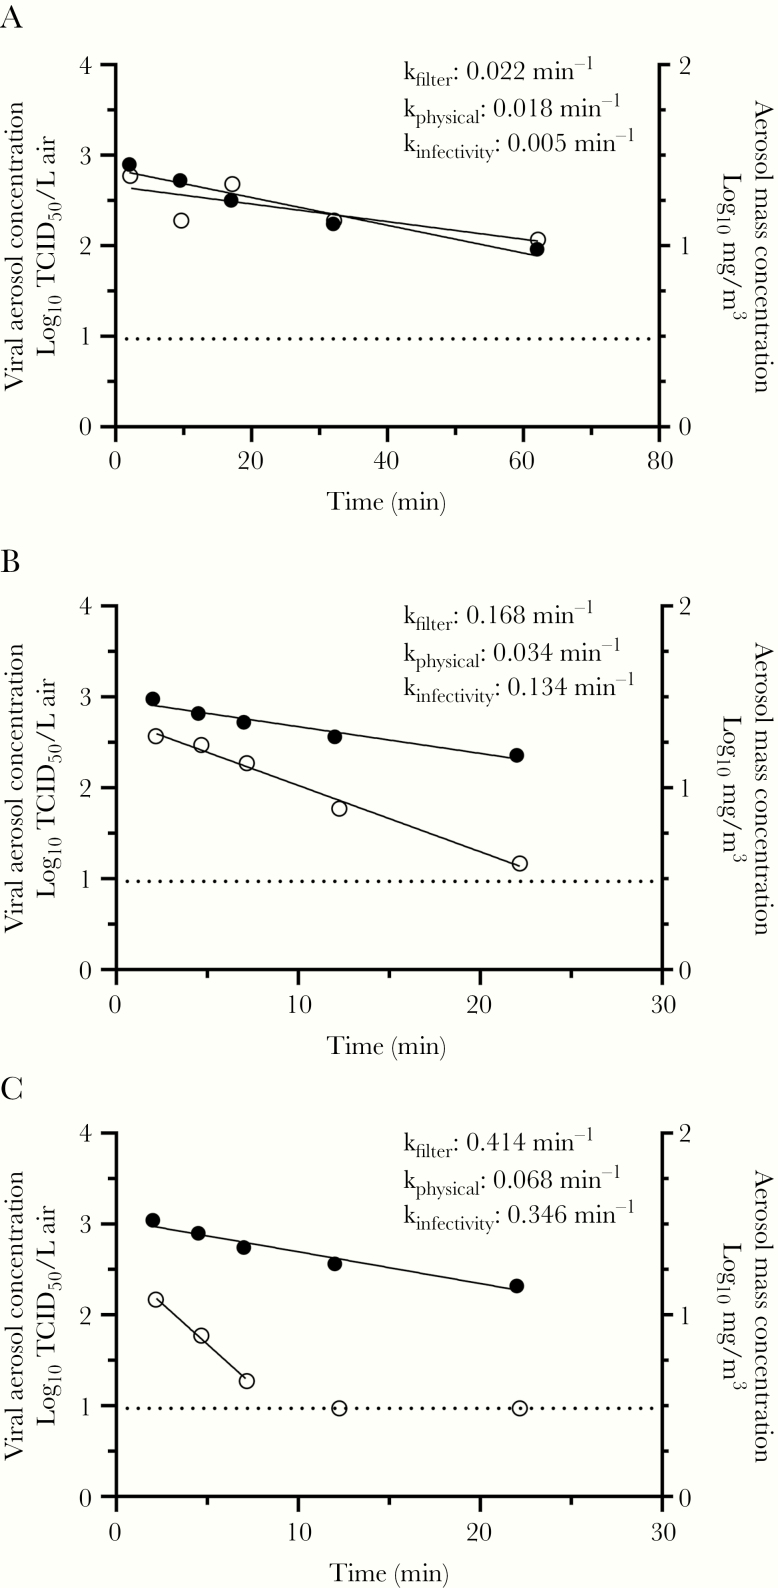
Figure 3.
Representative viral and mass aerosol concentration profiles for SARS-CoV-2 in simulated saliva. Representative decay profiles and associated decay constants for both viral infectivity and aerosol mass from individual tests are shown for (A) no simulated sunlight at 20% relative humidity and 20°C, (B) midintensity simulated sunlight at 45% relative humidity and 20°C, and (C) high-intensity simulated sunlight at 70% relative humidity and 20°C. The decay of the aerosol mass concentration, in log10 mg/m3 (black circles), was similar across the 3 tests, while the decay rate of infectious viral aerosols, in log10 median tissue culture infectious dose/L (TCID50/L) air (white circles), increased as the intensity of simulated sunlight was increased. The dashed line at 0.97 log TCID50/Lair indicates the limit of detection for infectious virus; points on this line were not included in curve fits.

