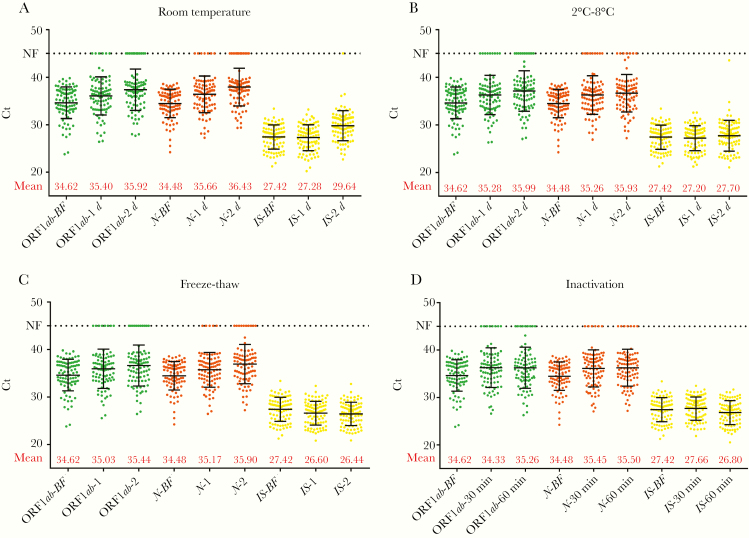
Figure 1.
Distribution of cycle threshold (Ct) values for SARS-CoV-2 target genes ORF1ab and N before and after different treatments. Distribution of Ct values measured in 88 SARS-CoV-2–positive throat swab samples before and after (A) storage at room temperature for 1 or 2 days; (B) storage at 2°C–8°C for 1 or 2 days; (C) 1 or 2 freeze-thaw cycles; and (D) inactivation at 56°C for 30 or 60 minutes. Bars indicates mean ± SD. Abbreviations: BF, analysis before test conditions; IS, internal standard (human RNase P gene); NF, no fluorescence signal at the maximum number of cycles (45).

