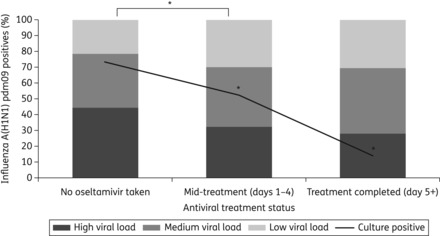
Figure 2.

The percentage of samples in each viral load group (shaded columns) is compared with antiviral treatment status, and overlaid with culture positivity rates (black lines). Samples were categorized according to the Ct value from the diagnostic real-time PCR: Ct <30 = high viral load, 30–34 = medium viral load and >34 = low viral load. *Viral loads in samples taken during oseltamivir treatment were significantly lower than those taken when no oseltamivir had been used (difference in Ct 1.28, 95% CI 0.90–1.64) after adjusting for the time from onset of symptoms to the swab date. Virus isolation (culture positive) was significantly reduced from samples taken during or after completion of oseltamivir treatment, compared with samples taken when no oseltamivir had been used.
