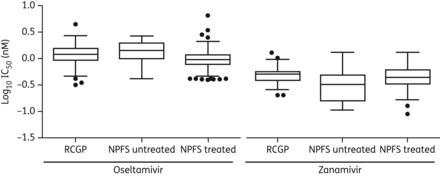
Figure 3.

Box and whisker plots comparing IC50 (in vitro susceptibility) values of oseltamivir and zanamivir from sentinel GP (primary care)- and NPFS-derived isolates. Boxes represent the 25th–75th percentile, the central line is the mean, and the whiskers represent 1.5 times the IQR. Circles are individual isolates with IC50 values greater or lower than 1.5 × IQR and are identified as statistical outliers.
