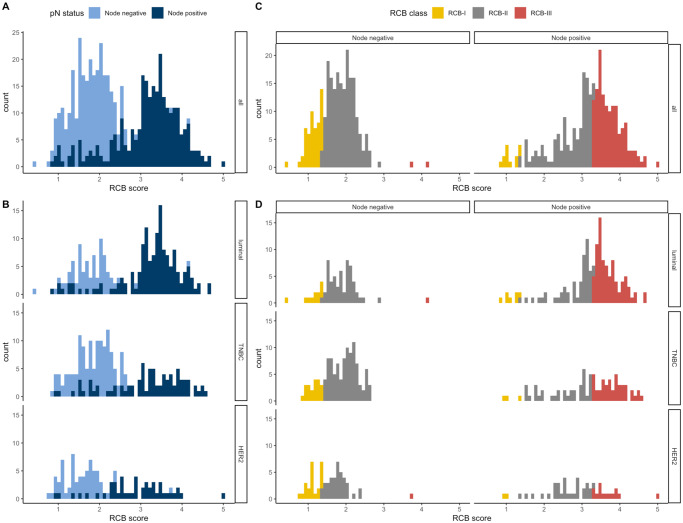
Fig 2.
Histograms of the distribution of residual cancer burden (RCB) index in the patients with residual disease at surgery immediately following NAC, in the whole population (A) and according to phenotype of disease (B). Histograms showing the distribution of nodal status (positive or negative) according to the RCB value, in the whole population (C) and according to the phenotype of disease (D).

