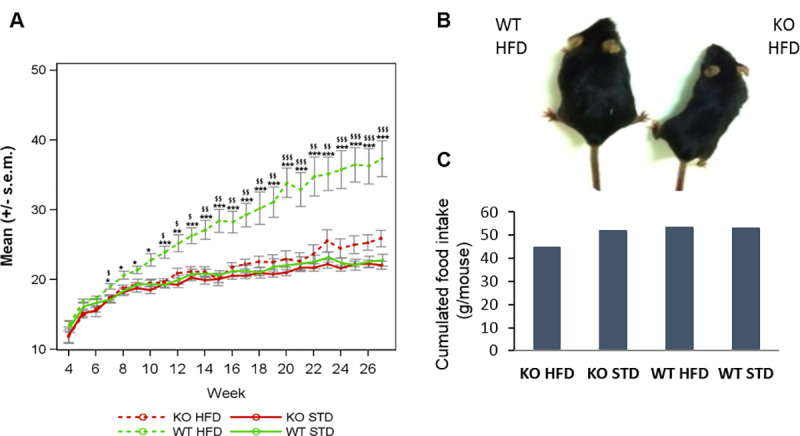
Fig 3. WT and KO ABHD11 female mice monitored in DIO1.

WT and KO mice were separated in 4 groups according to each diet (STD or HFD) A- The weight of mice (grams) was recorded weekly. The curves represent means +/- s.e.m. at each day for each group (n = 6–7). *: pvalue<0.05, **: pvalue<0.01, ***: pvalue<0.001: obtained using a post-hoc analysis to compare HFD versus STD group in WT genotype after a three-way ANOVA with repeated measures on time factor ¤: pvalue<0.05, ¤¤: pvalue<0.01, ¤¤¤: pvalue<0.001: obtained using a post-hoc analysis to compare HFD versus STD group in KO genotype after a three-way ANOVA with repeated measures on time factor $: pvalue<0.05, $$: pv alue<0.01, $$$: pvalue<0.001: obtained using a post-hoc analysis to compare WT versus KO group in HFD group after a three-way ANOVA with repeated measures on time factor #: pvalue<0.05, ##: pvalue<0.01, ###: pvalue<0.001: obtained using a post-hoc analysis to compare WT versus KO group in STD group after a three-way ANOVA with repeated measures on time factor.B- Representative photo of a WT mouse and a KO ABHD11 mouse under HFD at the end of DIO. C- Cumulative food intake measured weekly during 24h from week 5 to week 27 (N = 1 cage per group).
