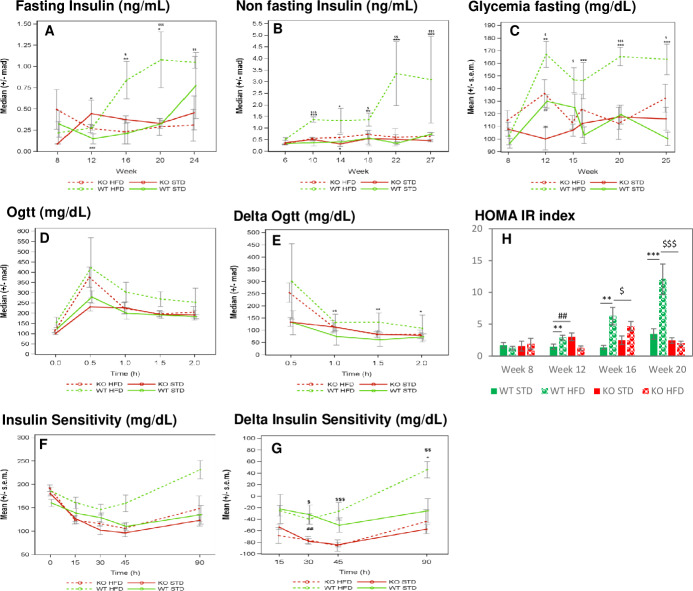
Fig 4. Measure of blood insulin and glycemia in mice of DIO1 in basal conditions (fasting or non fasting) and after glucose or insulin administration.
n = 6–7 mice/group. A- Blood insulin evolution measured in non fasting mice, B- Blood insulin evolution measured in fasting mice, C- Blood glycemia evolution measured in fasting mice, D-E- Oral Glucose Tolerance test performed at 15 weeks of age: Glycemia measured after oral glucose tolerance administration (D), representation of delta glycemia level (compared to glycemia measured at T0) (E), F-G- Insulin sentitivity test: Glycemia measured after IP insulin administration (F), representation of delta glycemia level (compared to glycemia measured at T0) (G). H- HOMA-IR (homeostasis model assesment of insulin resistance) index. Fig A, B, C, D, E: *: pvalue <0.05, **:pvalue <0.01, ***:pvalue <0.001: obtained using a post-hoc analysis to compare HFD versus STD group in WT genotype after a three-way ANOVA with repeated measures on time factor ¤: pvalue <0.05, ¤¤:pvalue <0.01, ¤¤¤:pvalue <0.001: obtained using a post-hoc analysis to compare HFD versus STD group in KO genotype after a three-way ANOVA with repeated measures on time factor $: pvalue <0.05, $$:pvalue <0.01, $$$:pvalue <0.001: obtained using a post-hoc analysis to compare WT versus KO group in HFD group after a three-way ANOVA with repeated measures on time factor #: pvalue <0.05, ##:pvalue <0.01, ###:pvalue <0.001: obtained using a post-hoc analysis to compare WT versus KO group in STD group after a three-way ANOVA with repeated measures on time factor. Fig H: pvalues obtained using a two-way ANOVA analysis.

