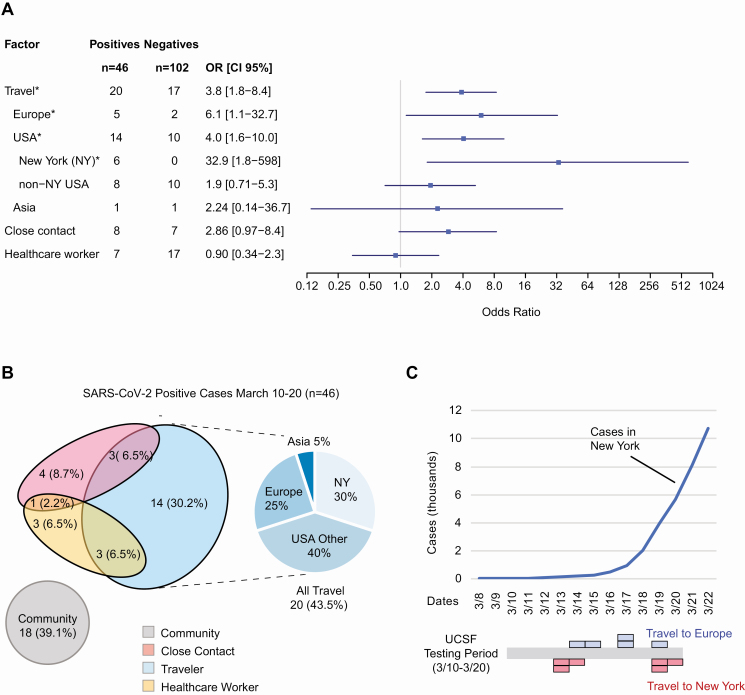
Figure 1.
A, Associations with positive COVID-19 RT-PCR testing. ORs with 95% CIs are shown. Positives (n = 46) were consecutive cases from 10 to 20 March 2020. Negatives (n = 102) were randomized from the same time period. Significant risk factors (P < .05) are designated with “*” and were recent travel, including Europe, United States (domestic), and/or New York (P values are shown in Supplementary Table 2). B, Venn diagram of risk factors in positive SARS-CoV-2 cases. All positive cases and their associations are shown here categorized as those with a recent travel history, who had a close contact who was COVID-19 positive, a frontline healthcare worker, or a combination of the previous categories (left). Those who did not match one of those categories were uniformly categorized as a community case. The most common association with a positive case was a travel history immediately prior to symptoms. Travelers (n = 20) are subdivided by travel region: New York (NY), non-NY USA, Europe, or Asia (right). C, Timeline of cumulative COVID-19 cases diagnosed in New York (top), and UCSF positive cases found in San Francisco who recently traveled to New York or Europe over time (bottom). Each colored block represents a single patient. Abbreviations: CI, confidence interval; COVID-19, coronavirus disease 2019; GISAID, Global Initiative to Share All Influenza Data (recently adapted to include SARS-CoV-2 sequences); Neg, negative; OR, odds ratio; Pos, positive; RT-PCR, reverse transcriptase–polymerase chain reaction; SARS-CoV-2, severe acute respiratory syndrome coronavirus 2; UCSF, University of California, San Francisco.

