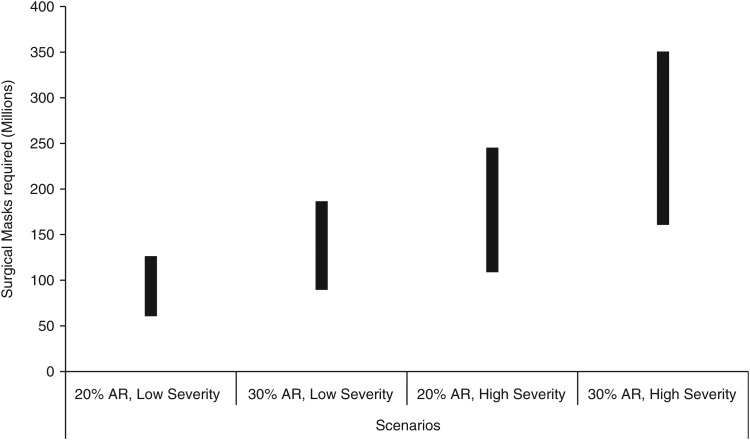
Figure 3.
Surgical mask demand by pandemic scenario. For each scenario, ranges result from variations in surgical mask use rates and epidemiologic and healthcare use parameters. Surgical mask demand is the same for the base, intermediate, and maximum scenario, as it is meant for source control and the number of patients is proportional to the epidemic curve. Abbreviation: AR, attack rate.

