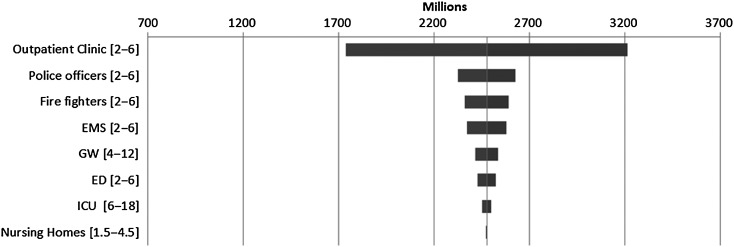
Figure 4.
Variation of demand for N95 filtering facepiece respirators (respirators) with usage rates for different settings; for the base case (bars are centered around approximately 2.5B, the estimated demand for respirators for the 20% Attack Rate; high severity scenario; each bar shows the minimum and maximum demand obtained when varying the parameters in the interval featured on the left axis). Interpretation: if respirator use rate in the outpatient sector changes to 2/day/healthcare worker (50% reduction), total demand for respirators reduces to 1.7 billion). Abbreviations: ED, emergency department; EMS, emergency medical service; GW, general ward; ICU, intensive care unit.

