FIGURE 3.

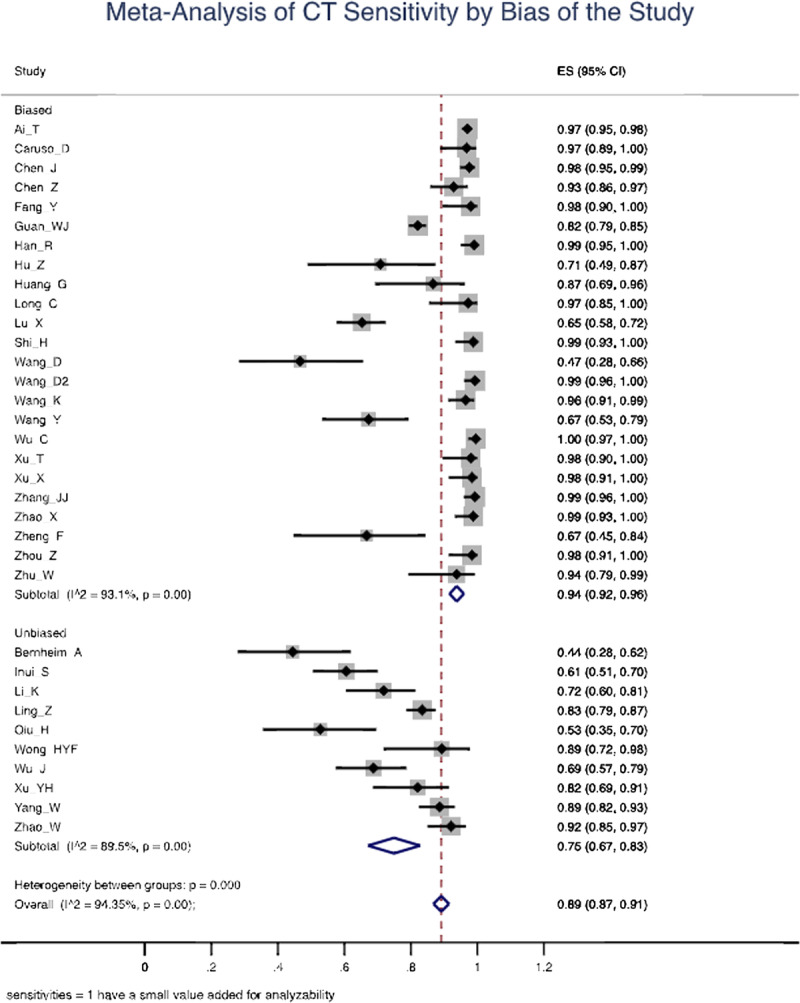
Forest plot of computed tomography (CT) studies showing the sensitivity of each study using a random effects model to control for heterogeneity and showing subgroups by bias in the studies.

Forest plot of computed tomography (CT) studies showing the sensitivity of each study using a random effects model to control for heterogeneity and showing subgroups by bias in the studies.