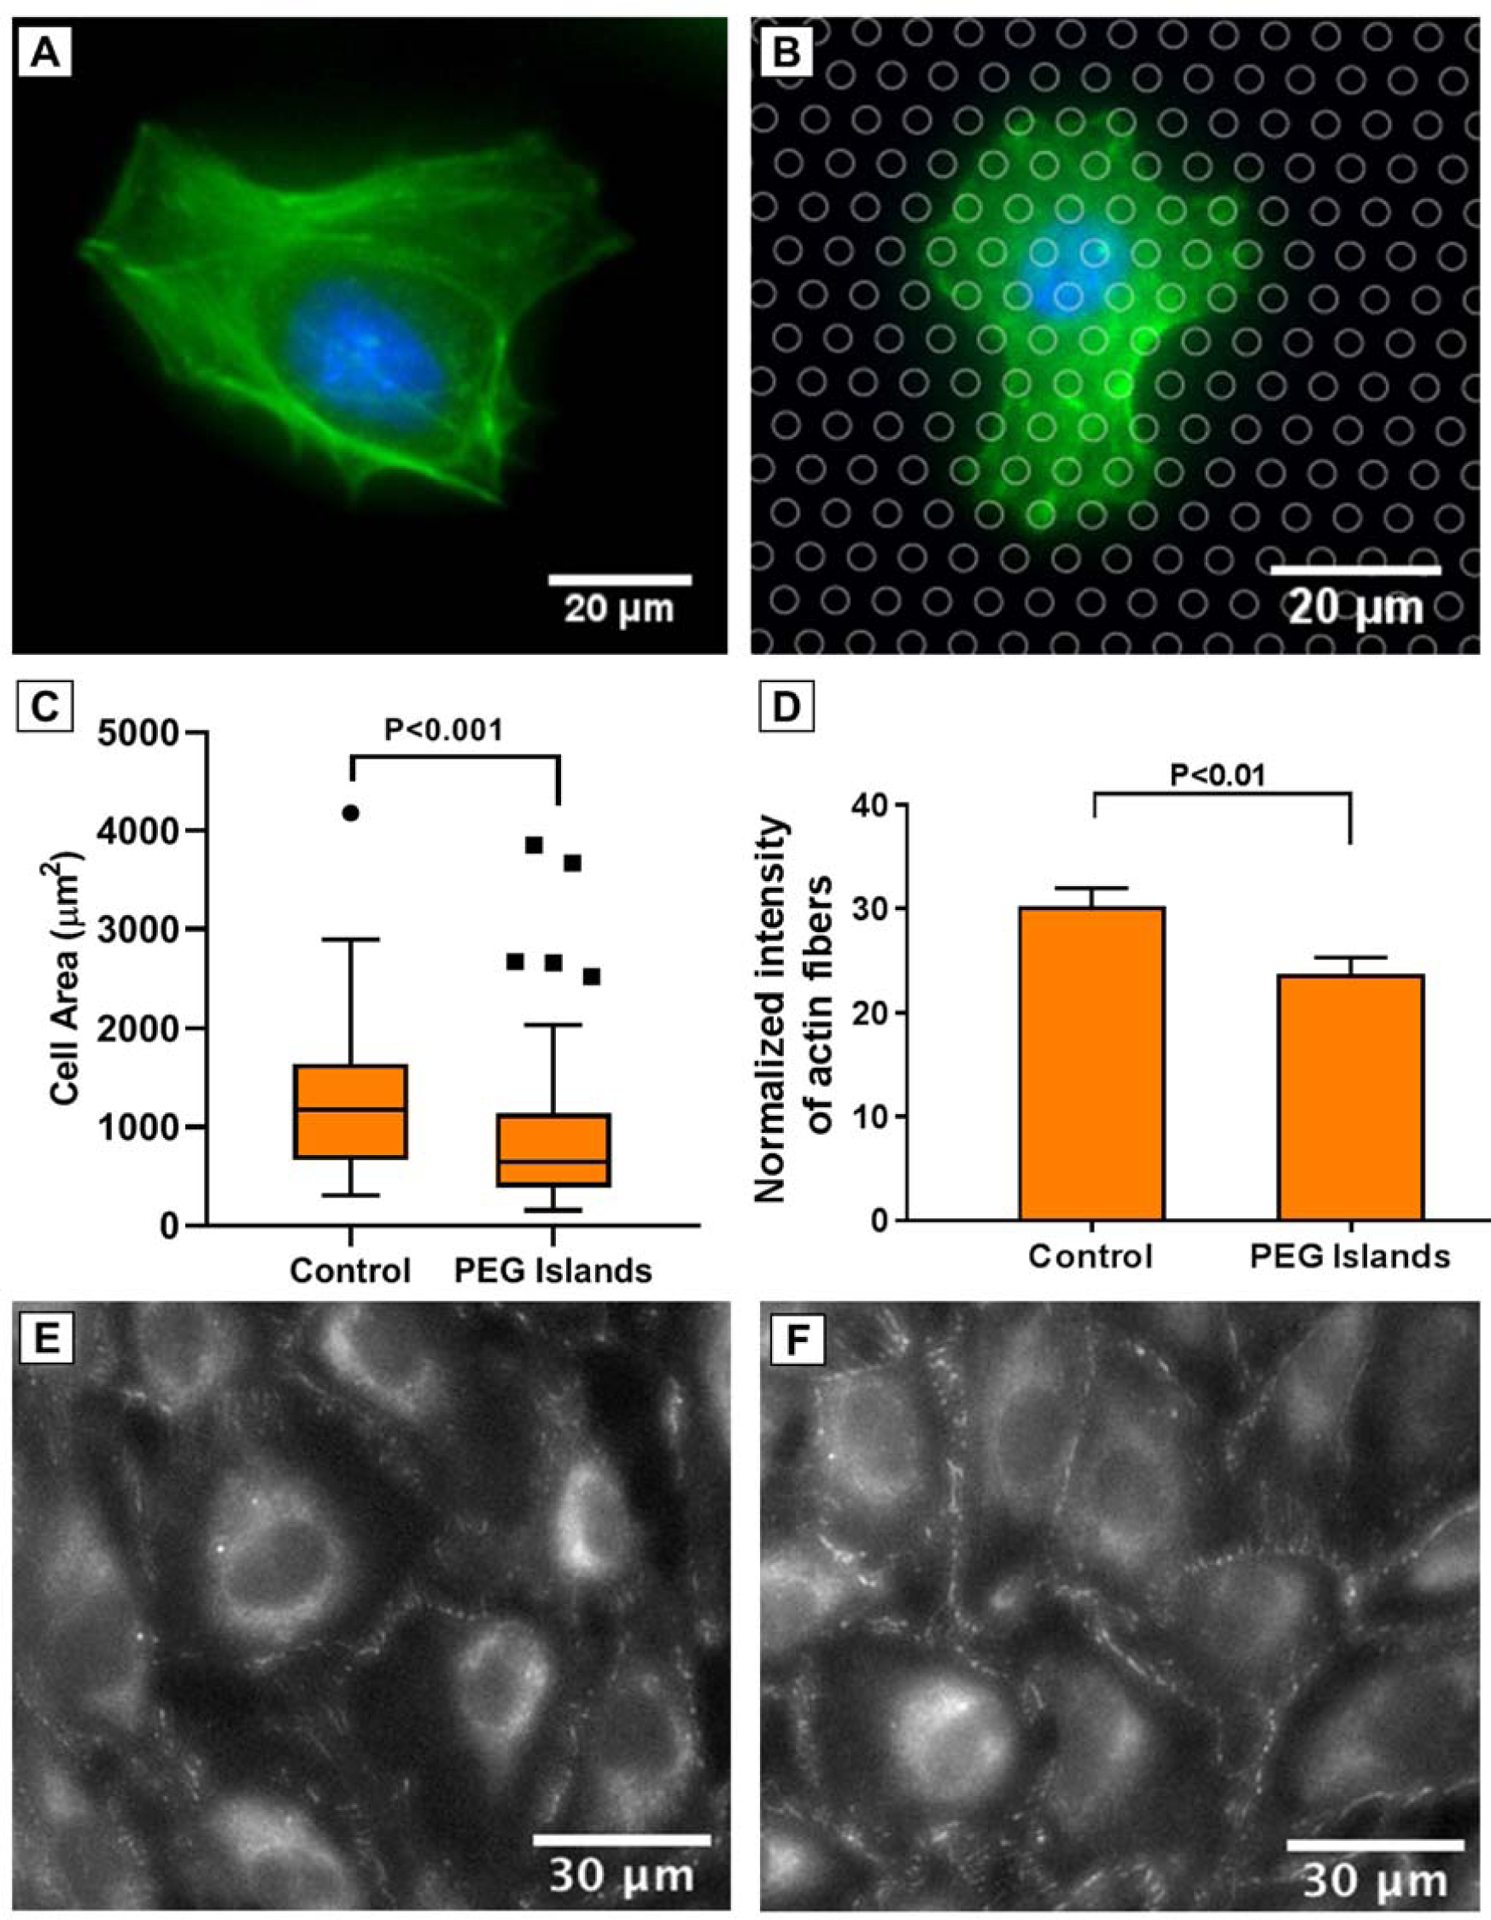
Figure 3.

Representative images of nuclei (DAPI, blue), and F-actin (phalloidin, green) after 24 h on (A) Control SiO2, and (B) PEG Islands. PEG islands are indicated by circles on the image B. (C, D) Cell area and Normalized intensity of F-actin, respectively. (n > 11 substrates; > 77 cells for each condition). (E, F) Representative images of ZO1 staining after 96 h on Control SiO2, and PEG Islands, respectively.
