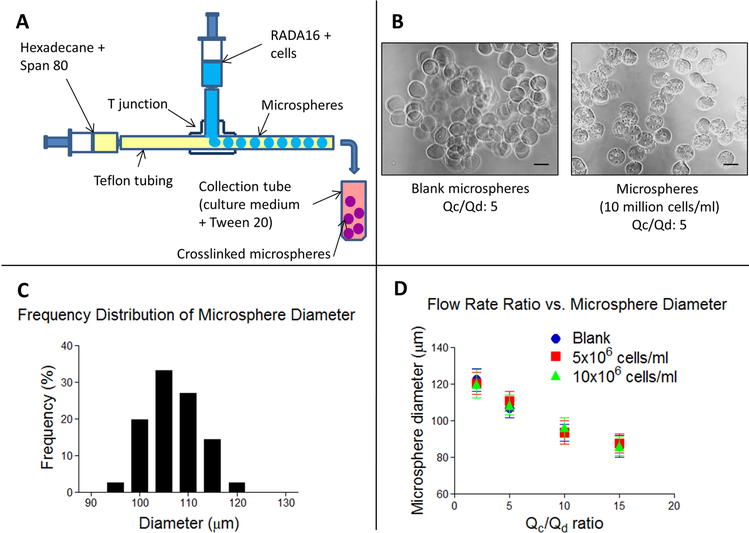
Figure 4.
Monodisperse RADA16-I microspheres were fabricated using a custom-made microfluidic T junction. (A) Schematic of the microsphere fabrication process. (B) Phase contrast images of blank and cell-containing microspheres. Scale bar: 100 μm. (C) Frequency distribution of blank microsphere diameter fabricated at a flow rate ratio of 5. (D) Graph illustrating the inverse relationship of microsphere diameter and flow rate ratio. Error bars: standard deviation.

