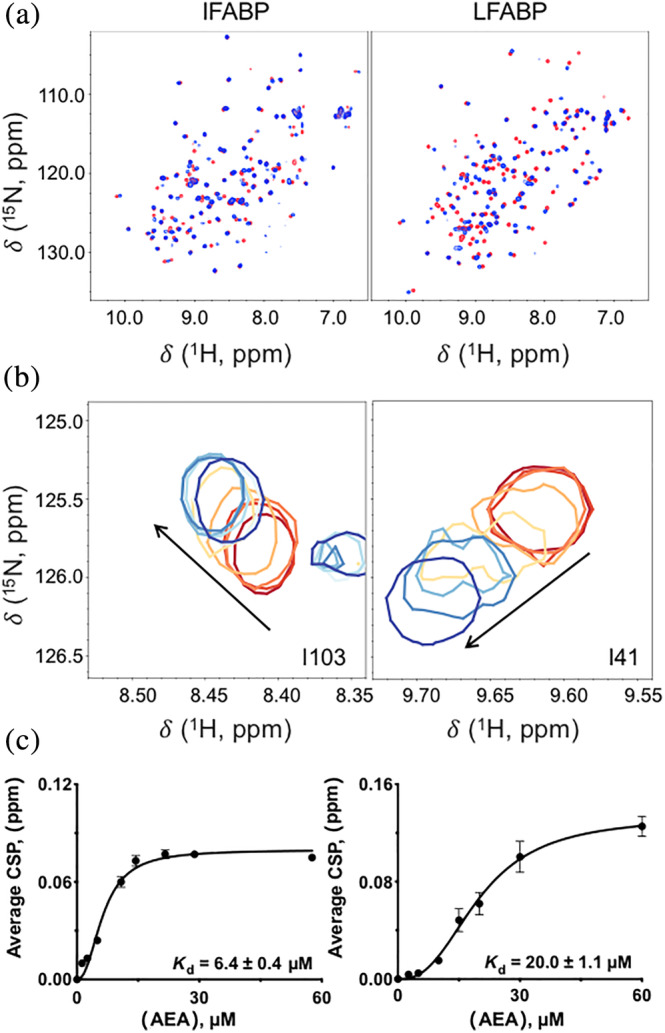
FIGURE 2.

NMR‐based determination of K d(ligand). (a) 1H–15N HSQC NMR contour plots for IFABP and LFABP in the absence of ligand (in red) superimposed on AEA‐bound FABP (blue). Ligand was freshly made and added immediately prior to data acquisition. The final molar ratio of FABP to AEA in the ligand‐bound spectra is 1:3. (b) Resonances of IFABP and LFABP exhibited fast exchange on the NMR timescale during titration of AEA. A subset of residues with titratable chemical shifts is shown at protein:ligand ratios of 1:n, where n has values of 0 (in red), 0.13, 0.25, 0.55, 0.73, 1.1, 1.5, or 3.0 (blue, highest tested). (c) Dependence of chemical shift perturbation (CSP) on concentration of ligand. The CSPs from several residues were averaged and plotted against ligand concentration in order to calculate K d(LIGAND). K d(LIGAND) values are given as ±SEM
