
FIGURE 6.
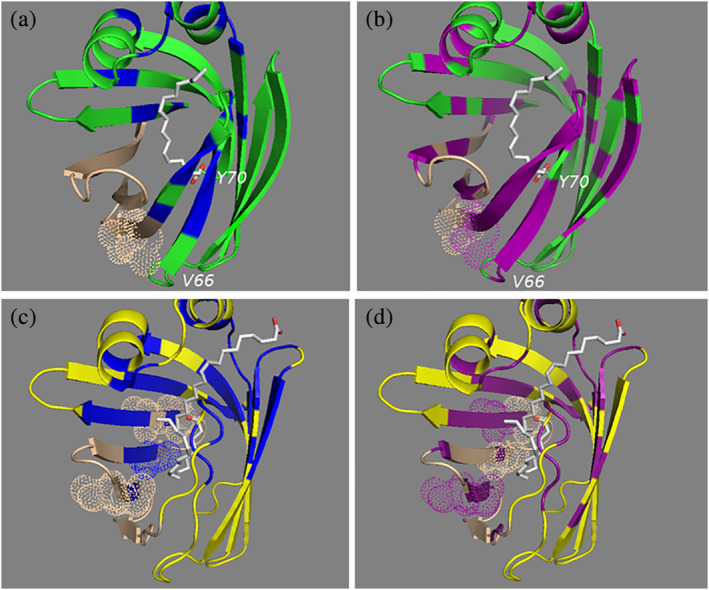
Structural representation of unique regions that interact with ligand. IFABP (pdb 2IFB) is shown with a green ribbon structure, and LFABP (pdb 1lfo) is shown with a yellow backbone. Residues that are significantly perturbed in the presence of ligand are shown in blue for FAs (OLA, ARA, PAL) and purple for ECs (AEA, 2‐AG). The residues of region 80–110 that are not significantly perturbed in the presence of ligand are shown in tan. (a) Shows that this region has no interactions with FAs for IFABP. IFABP has fewer threonine residues in this region than LFABP (shown with dot representations). (a, b) Also, the presence of ligand resulted in significant perturbations of IFABP in the region defined by residues 66–70, but the analogous region in LFABP was not involved in binding ligand (c, d)