Figure 1.
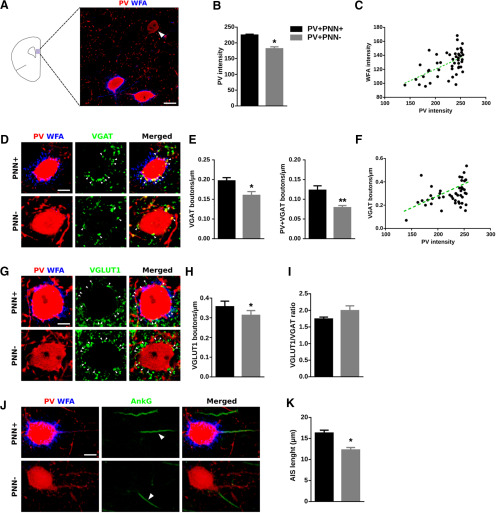
The presence or absence of PNNs surrounding PV+ interneurons influences PV expression in their somata and their perisomatic innervation. A, Schematic drawing of a coronal slide, highlighting the area analyzed and a representative immunostaining of the expression of PV and WFA in PrL. The white arrowhead points to a PV+ cell lacking PNN. Scale bar, 10 μm. B, Graph showing the expression of PV in PV+ cells surrounded versus not surrounded by PNNs. C, Distribution graph showing the positive correlation of PV fluorescence intensity and WFA fluorescence intensity. D, High-magnification single confocal planes comparing the inhibitory perisomatic innervation on PV+ cells depending on the presence or absence of PNNs. White arrowheads point to representative puncta. Scale bar, 4 μm. E, Graphs showing the lower density of perisomatic puncta expressing inhibitory markers on PNN– PV cells. F, Distribution graph showing the positive correlation of PV fluorescence intensity and density of inhibitory perisomatic puncta. G, Single confocal planes of VGLUT1-expressing perisomatic puncta on PV+ cells. Scale bar, 4 μm. H, Graph showing the density of VGLUT1+ puncta on the perisomatic region of PV+ cells. I, Graph comparing the ratio of excitatory/inhibitory perisomatic puncta on PV+ cells. J, Representative images of the AIS from PV+ cells. White arrowheads point to the AIS. Scale bar, 6 μm. K, Graph comparing the length of the AIS in PV+ cells surrounded versus not surrounded by PNNs. *p < 0.05, **p < 0.01.

