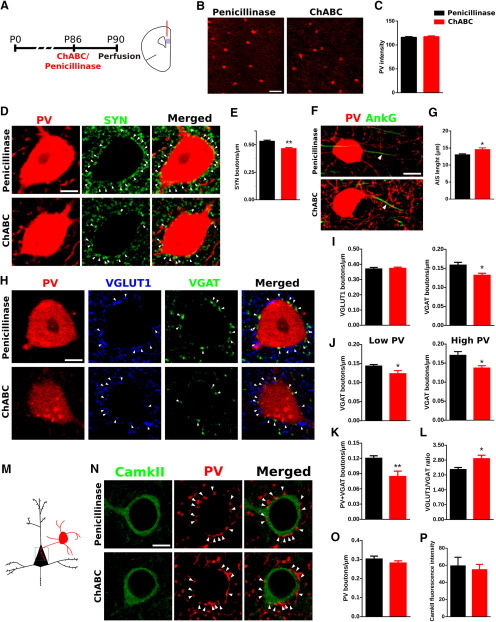
Figure 4.
Effects of ChABC on PV expression and perisomatic puncta in the PrL. A, Scheme of experimental timeline and drawing of a coronal slide, highlighting the area of study. B, Representative confocal stacks of PV immunostaining in the PrL. C, Graph showing the PV fluorescence intensity in PrL. D, Single confocal planes showing SYN-expressing puncta (white arrowheads) surrounding the soma of a PV+ cell. Scale bar, 5 μm. E, Graphs showing that ChABC treatment induces a decrease in the density of SYN-expressing puncta on the perisomatic region of PV+ cells. F, Confocal reconstruction (three planes) of PV+ cells and their AIS. Arrowheads point to AIS stained by AnKG. Scale bar, 8 μm. G, Graph comparing the length of the AIS in PV+ cells after penicillinase and ChABC injection. H, Single confocal planes showing the density of excitatory (VGLUT1+) and inhibitory (VGAT+) perisomatic puncta (white arrowheads) on PV+ cells. Scale bar, 5 μm. I, Graphs showing the ChABC induced decrease in the density of inhibitory but not excitatory puncta on the perisomatic region of PV+ cells. J, Histograms showing that decrease in inhibitory puncta occurs both in low PV and high PV cells. K, Graph showing the significant decrease induced by ChABC on the density of puncta coexpresssing VGAT and PV in the perisomatic region of PV+ cells. L, Graphs showing the ratio between the densities of VGLUT1/VGAT-expressing puncta. M, Schematic drawing showing the area of analysis highlighted by a gray square. N, Single confocal planes showing PV-expressing puncta (white arrowheads) on the perisomatic region of pyramidal neurons. Scale bar, 5 μm. O, Graph showing the effects of ChABC treatment on the density of PV+ perisomatic puncta on pyramidal neurons. P, Graph showing intensity of CamkII fluorescence in the cell body of pyramidal neurons. *p < 0.05, **p < 0.01.

