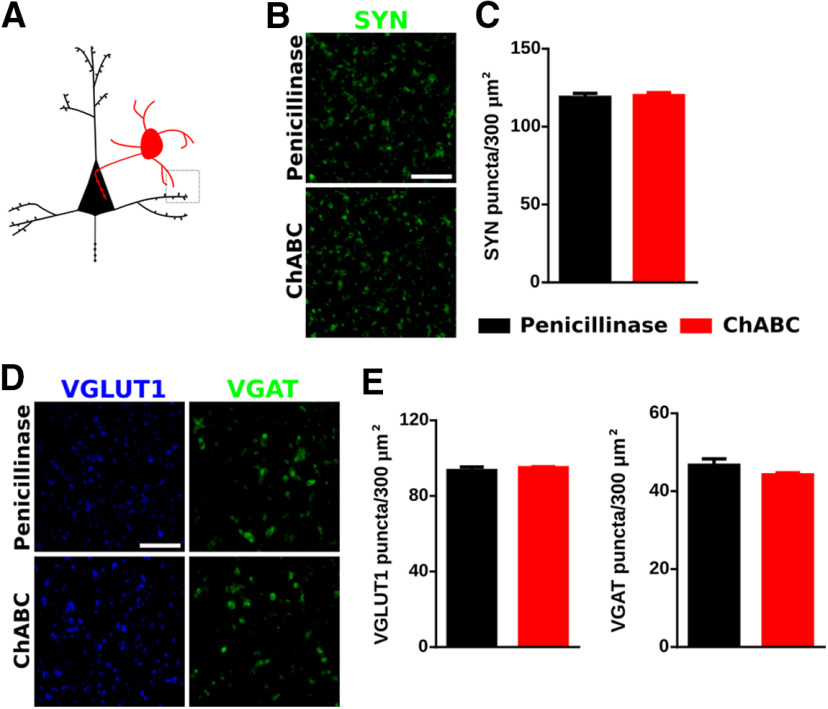
Figure 5.
ChABC effects on the neuropil of the PrL. A, Schematic drawing of the area imaged. B, Representative confocal planes showing SYN-expressing puncta in the neuropil. Scale bar, 6 μm. C, Graph showing the effects of ChABC on the density of SYN+ puncta in the neuropil. D, Representative confocal planes of VGLUT1+ and VGAT+ puncta. Scale bar, 6 μm. E, Graphs showing the effects of ChABC on the density of VGLUT1+ and VGAT+ puncta.

