Figure 1.
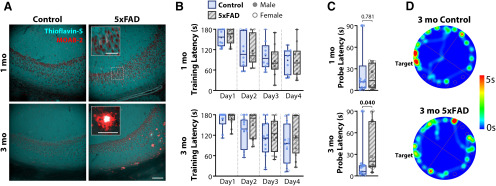
Three-month 5xFAD mice deposit amyloid and display minor impairment in spatial memory. A, Representative IHC in the CA1 – subiculum region in one month (top) and three months (bottom) for control (CT, left) and 5xFAD (right) mice. Red, MOAB-2, labeling both intraneuronal and extracellular Aβ, including unaggregated, oligomeric, and fibrillar Aβ42 and unaggregated Aβ40. Cyan, Thioflavin-S, labeling fibrils in extracellular plaques. Staining was repeated in two mice of each genotype and age. Scale bar = 100 μm. Inset scale bars = 50 μm. B, Cohorts of one-month (nmice = 10 CT, 10 5xFAD; top) and three-month (nmice = 15 CT, 12 5xFAD; bottom) mice, were trained on the Barnes maze, consisting of 4 d of training, each with four 180 s trials. The latency to find the target escape hole was averaged over the four trials. C, Latency to find target on the final 90-s probe trial on the fifth day for one-month (top) and three-months (bottom) cohorts. D, Representative heat map for three-month animals on the final probe trial. Warmer colors represent longer duration. Control mice spent more time at the target and surrounding region than 5xFAD mice. For all plots, individual data points represent an animal. Closed circles represent males, open circles females. Box-whisker plots represent non-normal data as Median and IQRs; p values indicated above brackets.

