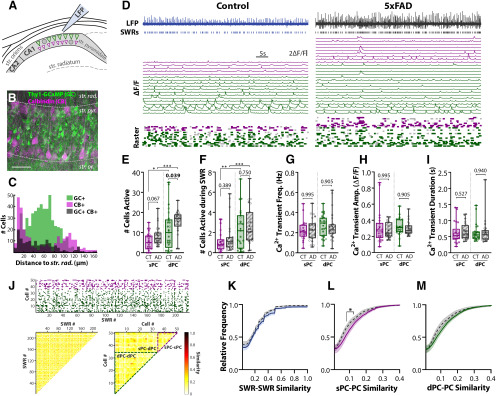
Figure 3.
Altered ensembles of PCs are recruited in 5xFAD slices. A, Confocal imaging of PC ensembles were recorded concurrently with SWRs. Scale bars = 50 μm. B, Post hoc IHC for CB of imaged Thy1-GCaMP6f (GC) slices. Dashed gray lines approximately distinguish layers of hippocampus, str. rad. = stratum radiatum, str. pyr. = stratum pyramidale, str. or. = stratum oriens. Scale bar = 50 μm. C, Histogram of the distance from the center of the cell body to the str. pyr./rad. border for 539 GC+ CB–, 292 GC– CB+, and 146 GC+ CB+ cells pooled from nslice = 4 from nmice = 2 CT, 2 5xFAD. D, LFP and ΔF/F for identified cells in slices from three-month control (left) and 5xFAD (right) mice. Top trace, LFP trace with identified SWR events in raster below. Middle traces, Individual ΔF/F for each cell, sPCs in magenta, and dPCs in green. Bottom raster, Identified Ca2+ events above threshold. Dark colored event indicate concurrence with SWR, light gray indicates spontaneous event. E, The total number of active sPCs and dPCs for CT (nslice = 25) and 5xFAD (nslice = 23) slices. F, The number of sPCs/dPCs active during SWRs. Frequency (G), amplitude (H), and duration (I) of Ca2+ transient events averaged across sPCs and dPCs for each slice. J, top, Event matrix displaying for one example recording, the SWR events on the x-axis, and cells on the y-axis (magenta = sPC, green = dPC). Bottom left, Pairwise Jaccard similarity between SWR events (columns in event matrix). Similarity matrix is symmetric and the diagonal = 1 by definition - these have not been plotted for clarity. Bottom right, Pairwise Jaccard similarity between cells (rows in event matrix). Dashed lines indicate borders between sPC-sPC, sPC-dPC, and dPC-dPC comparisons. Quantification of cell similarity was performed by grouping all sPC-PC comparisons (sPC-sPC and sPC-dPC), and all dPC-PC comparisons (dPC-dPC and sPC-dPC). Cumulative distribution functions were calculated from all pairwise comparisons for (K) SWR-SWR similarity, (L) sPC-PC similarity, and (M) dPC-PC similar. K–M, All showed significant genotype differences via two-way ANOVAs; asterisks indicate regions surviving multiple comparisons; *p < 0.05, **p < 0.01, ***p < 0.001. Box-whisker plots represent non-normal data with median and IQRs. Individual data points represent a slice. Closed circles represent slices from males, open circles females; p values of pairwise comparisons indicated above brackets.

