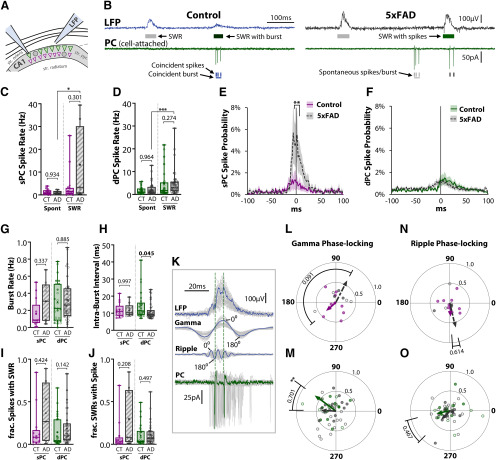
Figure 4.
PC spiking is relatively unchanged in 5xFAD mice. A, Diagram of a loose cell-attached recording of spikes from a Thy1-GCaMP6f+ PC paired with LFP recording of SWRs. B, Example traces from three-month control (left) and 5xFAD (right) slice. Top trace, LFP with SWR events in raster below. Gray shaded events indicate spontaneous SWR. Green shading indicates SWR coincident with at least one spike. Dark green shading indicates SWR coincident with burst, defined as three or more spikes each within 60 ms. Bottom trace, Cell-attached recording from PC. Detected spikes and bursts indicated in raster below. Dark shading indicates they are coincident with SWR event, light gray shading indicates spontaneous events. Spike rates were calculated separately during spontaneous and SWR periods for (C) sPCs, nsPC = 13 CT, 9 5xFAD, and (D) dPCs, ndPC = 26 CT, 35 5xFAD. The peri-SWR spike probability was calculated for (E) sPCs and (F) dPCs, by binning spikes into 100 2-ms bins and normalizing by total number of SWRs. Dark lines indicate average of all cells within a genotype, shaded regions indicate SEM, 0 ms indicates time of SWR peak. G, The rate of bursts for sPCs and dPCs, defined as at least three spikes each within 60 ms. H, Intraburst interval for sPCs and dPCs, defined as the average time between successive spikes in a burst. I, The fraction of spikes that occurred during SWRs. J, The fraction of SWRs that had one or more spikes. K, Example of SWR (top trace), with filtered slow γ (20–50 Hz) and ripple (120–220 Hz) signals (middle traces). The phase of oscillations was set at 0° at peaks and 180° at troughs. Bottom trace, Cell-attached recording, with spike times marked by vertical dashed lines. L–O, Polar phase plots of phase-locking of spikes to SWR-nested slow γ (L–M) and ripple (N–O) for sPCs (L, N) and dPCs (M, O). The angles of individual data points represent the average phase of all spikes for a cell. Length from origin (0–1) indicates the degree of phase-locking. A length of 1 signifies perfect phase-locking (every spike at same phase); a length of 0 indicates random or no phase-locking. Lines with arrowheads represent cell average, solid colored = CT, dashed gray = 5xFAD. Asterisks indicate result of Raleigh's test for non-uniformity, *p < 0.05, **p < 0.01, ***p < 0.001. p Values indicate results of circular mean comparison. For all plots, individual data points represent a cell. Closed circles represent cells from males, open circles females. Box-whisker plots represent non-normal data as median and IQRs; p values of pairwise comparisons indicated above brackets.

