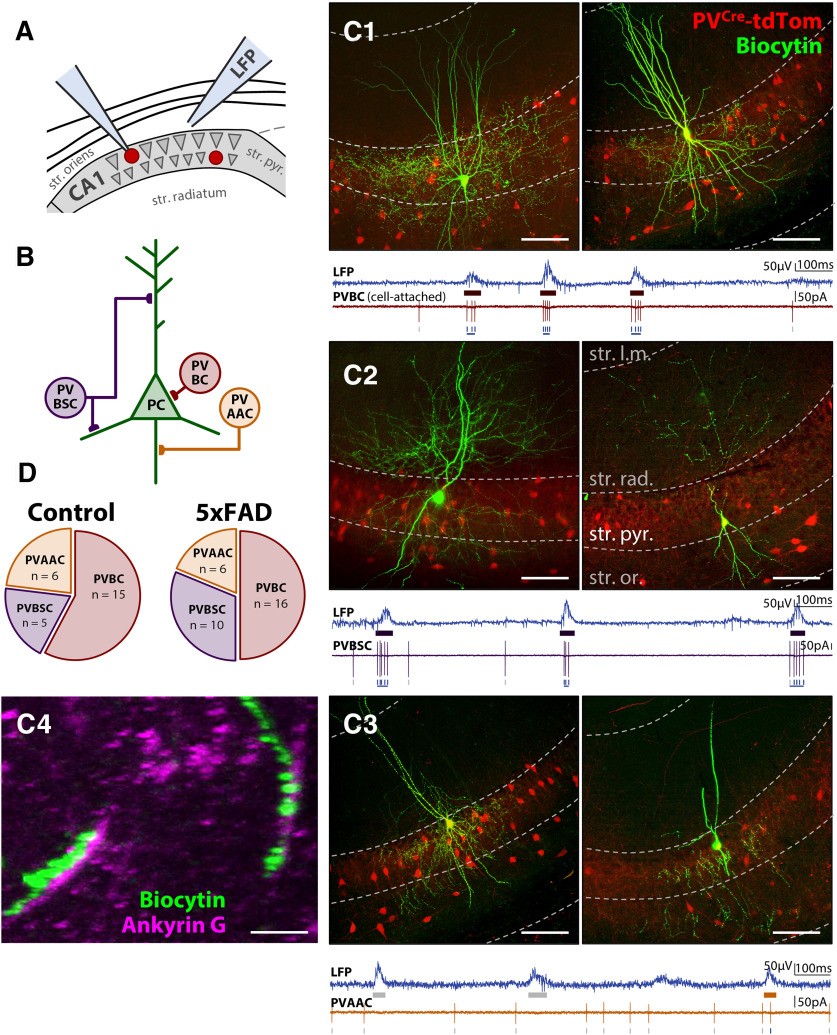
Figure 6.
PV cells in CA1 delineate into basket (PVBCs), bistratified (PVBSCs), and axo-axonic (PVAACs) cells. A, Diagram of LFP + PV cell recording in three-month 5xFAD/+; PVCre/+;tdTom/+ and PVCre/+;tdTom/+ littermate controls. B, Diagram of PV cell subtypes and their axonal targets in CA1 str. pyr. Examples of (C1) PVBCs, (C2) PVBSCs, and (C3) PVAACs. Green fluorescence indicates avidin-fluorescein bound to the biocyin in the filled PV cell. Red fluorescence indicates PVCre-dTom expression. Dashed gray lines approximately distinguish layers of hippocampus, str. l.m. = stratum lacunosum-moleculare, str. rad. = stratum radiatum, str. pyr. = stratum pyramidale, str. or. = stratum oriens. Notice that str. pyr. is dimly red due to the expression of other non-filled PVBCs targeting perisomatic regions of PCs. Scale bars = 100 μm. Bottom traces, Examples of LFP and cell-attached recording of spikes, which was used to aid in distinguishing PVBCs and PVAACs. PVAACs are unique in that they reduce their firing during SWRs. C4, Ankyrin G immunostaining showing co-localization of synaptic boutons with AIS of PCs for identified PVAAC. Scale bar = 10 μm. D, Proportions of sorted cells in each genotype.

