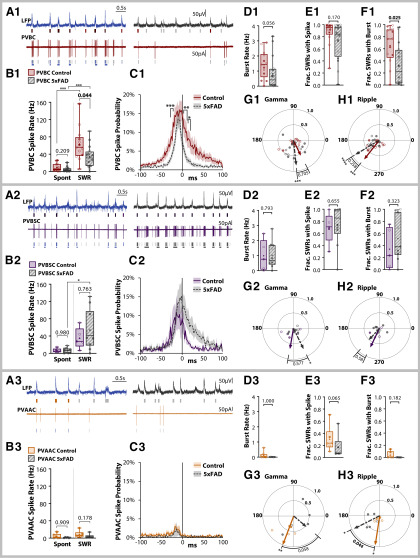
Figure 7.
PVBCs have selectively reduced spiking. Spiking data for PVBCs (panel subheading 1), PVBSCs (panel subheading 2), and PVAACs (panel subheading 3). A, Example LFP and cell-attached traces for CT (left) and 5xFAD (right), for a PVBC (A1), PVBSC (A2), and PVAAC (A3). Spike and SWR events are color-coded as in Figure 4B. B, Summary spike rate data for PVBCs (nPVBC = 13 CT, 16 5xFAD, B1), PVBSCs (nPVBSC = 5 CT, 10 5xFAD, B2), and PVAACs (nPVAAC = 6 CT, 6 5xFAD, B3) during spontaneous and SWR periods. C, Peri-SWR spike probability. Asterisks indicate regions surviving Šidák's multiple comparisons correction. D, Burst rate, defined as 3 or more spikes each within 40 ms. E, The fraction of SWRs with one or more spike. F, The fraction of SWRs with a burst. G-H, Polar phase plots of phase-locking of spikes to SWR-nested slow γ (G) and ripple (H). The angles of individual data points represent the average phase of all spikes for a cell. Length from origin (0–1) indicates the degree of phase-locking. Lines with arrowheads represent cell average, solid colored = CT, dashed gray = 5xFAD. Asterisks indicate result of Raleigh's test for non-uniformity, p values indicate results of Watson–Williams or circular mean test; *p < 0.05, **p < 0.01, ***p < 0.001. For all plots, individual data points represent a cell. Closed circles represent cells from males, open circles females. Box-whisker plots represent non-normal data with Median and IQRs; p values indicated above brackets.

