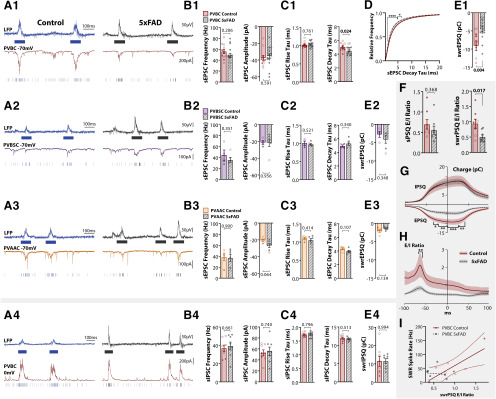
Figure 8.
PVBCs have selective decrease in excitatory synaptic input and decreased E/I ratio. Whole-cell data for PVBC EPSCs (panel subheading 1), PVBSC EPSCs (panel subheading 2), PVAAC EPSCs (panel subheading 3), and PVBC IPSCs (panel subheading 4). A, Example recordings of LFP + whole-cell PV cell recording in three-month 5xFAD/+; PVCre/+;tdTom/+ and PVCre/+;tdTom/+ littermate controls, recording synaptic input during spontaneous and SWR period. EPSCs were recorded at −70 mV in PVBCs (A1), PVBSCs (A2), and PVAACs (A3), and IPSCs recorded at 0 mV in a subset of PVBCs (A4). B, Summary data for spontaneous PSC frequency and amplitude for PVBC sEPSCs (nPVBC = 12 CT, 16 5xFAD, B1), PVBSC sEPSCs (nPVBSC = 4 CT, 6 5xFAD, B2), PVAAC sEPSCs (nPVAAC = 5 CT, 6 5xFAD, B3), and PVBC sIPSCs (nPVBC = 8 CT, 8 5xFAD, B4). C, Spontaneous PSC kinetics: rise and decay tau. D, Cumulative distribution function of PVBC decay tau. Dark lines represent cell average, shaded region represents SEM. E, swrEPSQ and swrIPSQ = total excitatory and inhibitory charge during SWRs, integrated over a 100-ms window centered around the SWR peak. F, left, PVBC spontaneous synaptic E/I ratio of normalized charge (sEPSQ/sIPSQ). F, right, PVBC synaptic E/I ratio for 100-ms window centered around SWR peak (swrEPSQ/swrIPSQ). G, The charge for each PVBC (EPSQ and IPSQ), calculated in 2-ms bins by integrating the current in a sliding 100-ms window centered around that bin. Summary data in E1, E4 thus represent these curves at the y-intercept. Asterisks indicate regions that survived Šidák's multiple comparisons; *p < 0.05, **p < 0.01, ***p < 0.001, ****p < 0.0001. H, The ratios of curves in G yield the synaptic E/I ratio during SWRs. Summary data in F represents these curves at the y-intercept. I, Linear regression of spike rate during SWRs versus the E/I ratio. For all plots, individual data points represent a cell. Closed circles represent cells from males, open circles females. Bar plots represent normal data with Mean ± SEM; p values indicated above brackets.

