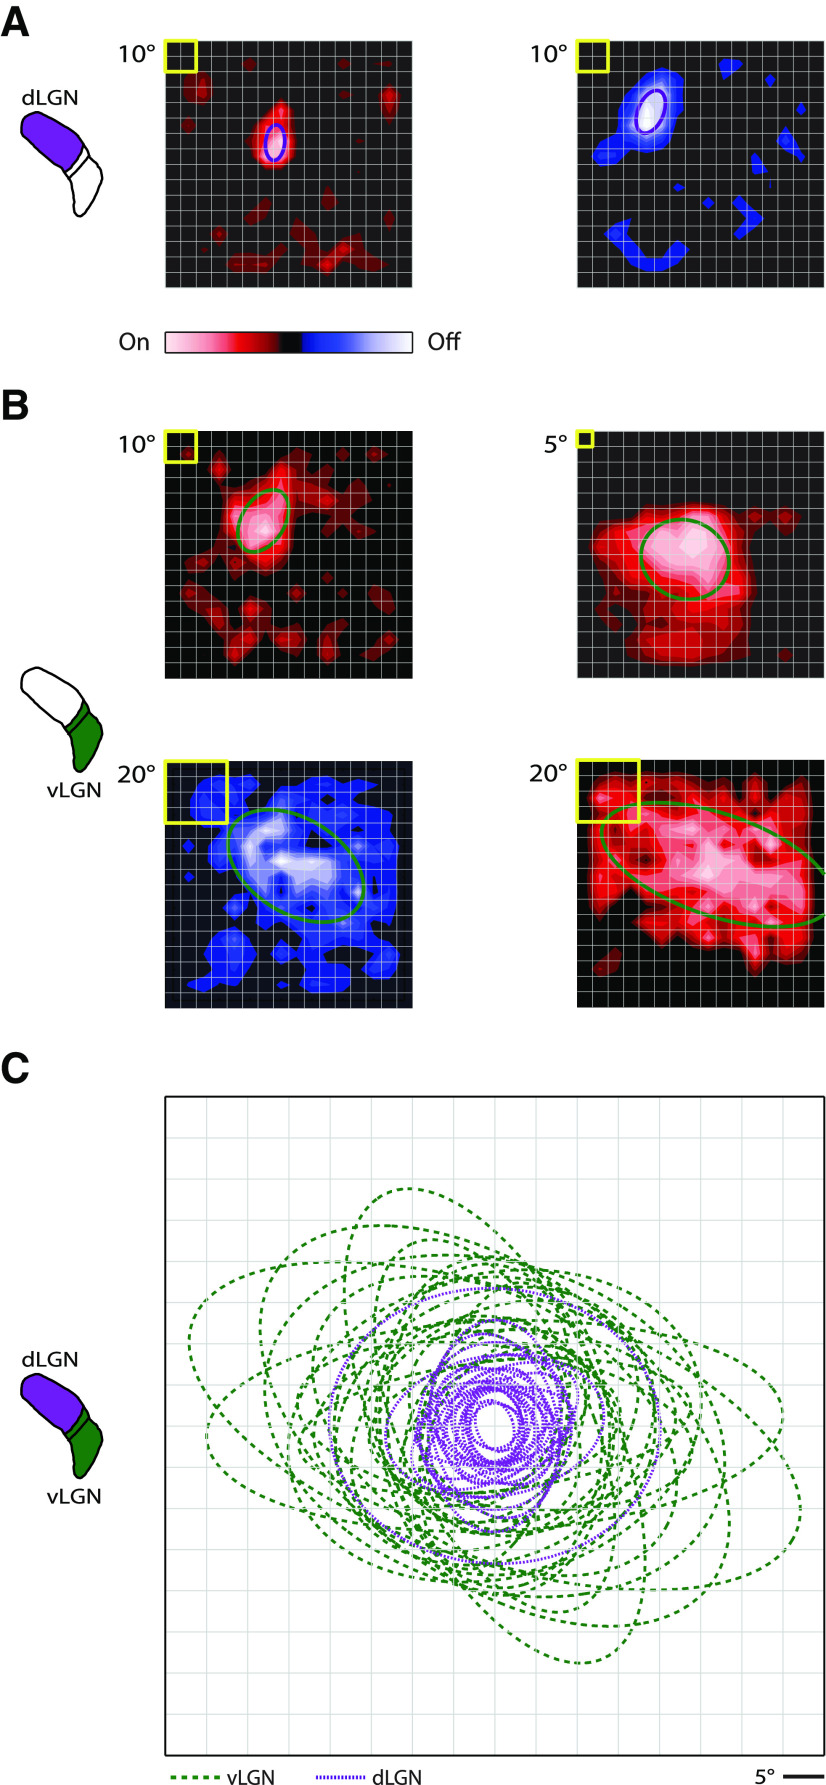
Figure 1.
Receptive field structure in dLGN and vLGN. A, Contour plots of two sample receptive fields from dLGN derived from membrane currents of an On-center (red, left) and Off-center relay cell (blue, right). The stimulus was sparse noise. Yellow box at top left corner of each contour plot indicates stimulus size. Overlays are 1σ contours from 2D Gaussian fits of the receptive fields. B, Sample receptive fields in vLGN for three On cells (top left, top right, bottom right) and an Off cell (bottom left); conventions as in A. C, Plot of the 1σ contours for receptive fields of relay cells in dLGN (purple, dotted lines) and cells in vLGN/IGL (green, dashed lines); the contours are aligned at each receptive field center.

