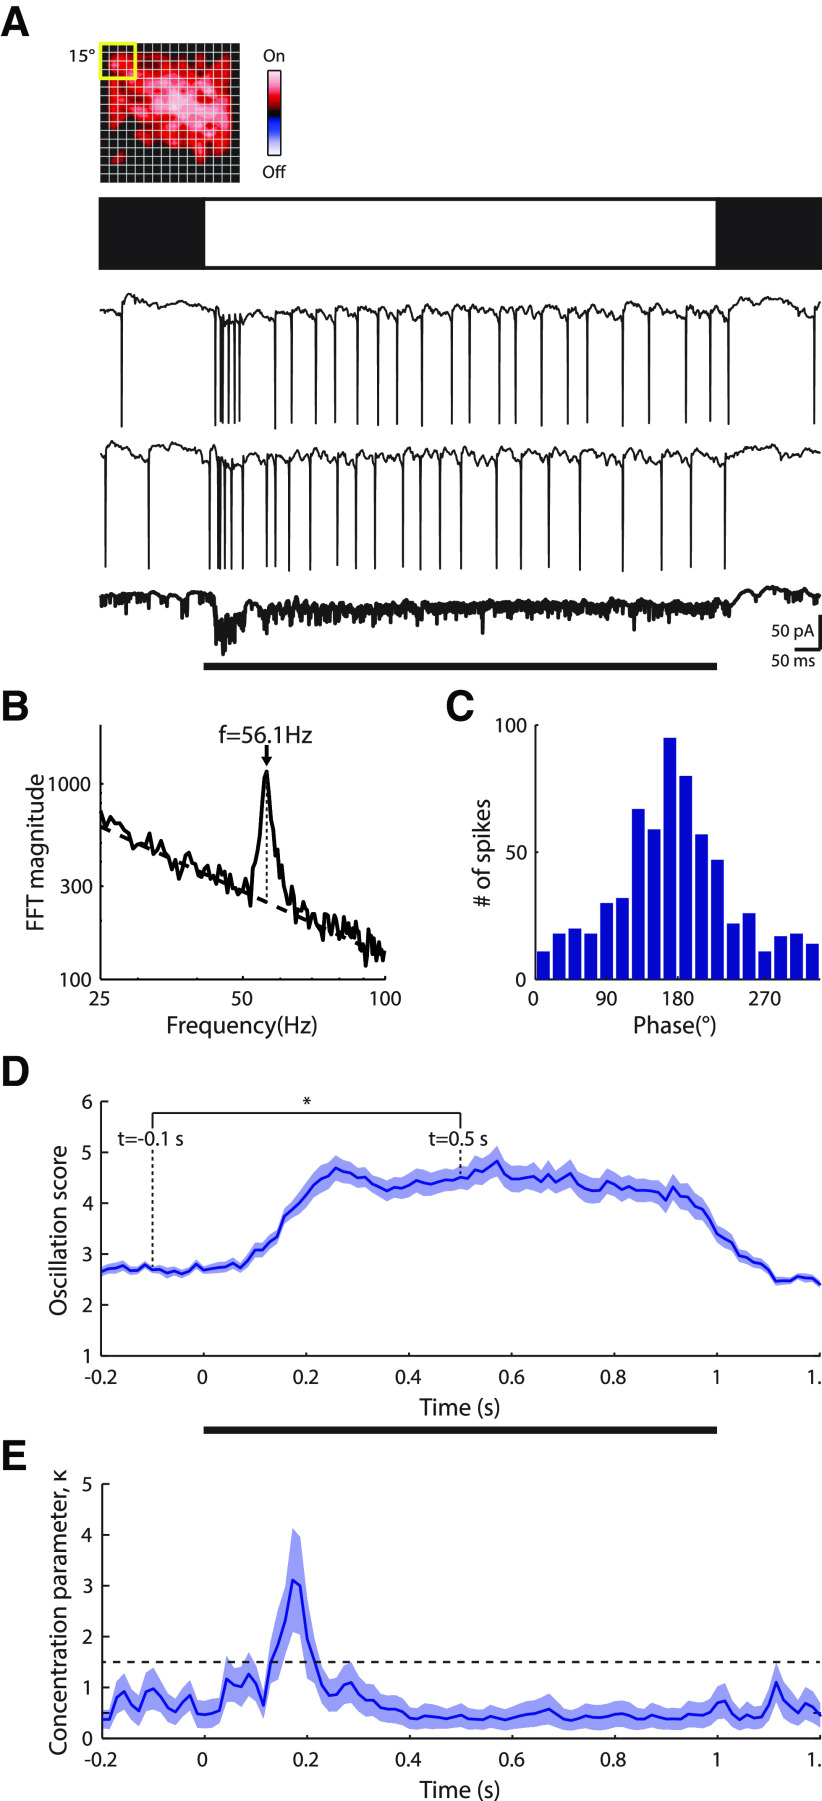
Figure 6.
Flash-evoked gamma band oscillatory currents for a sample ON cell in vLGN. A, Top, Contour plot of the receptive field; conventions as in Figure 1. Middle, Icon depicting a full-field bright stimulus. Bottom, Two individual responses to the stimulus, and the average across trials, bolded and at 2× gain. B, Illustration of how the oscillation score analysis was adapted for membrane currents. The oscillation frequency is computed by taking the frequency that has the highest amplitude (dotted vertical line) with respect to the linear trend (dashed line) in the spectrum (plotted on a logarithmic scale). The oscillation score is then computed as the relative spectrum amplitude, normalized by the trend, at the oscillation frequency. C, Histogram of phase coherence between intracellular currents and spikes during the stimulus reveals temporal locking between synaptic input and neural output. D, Plot of the mean ± SEM of the oscillation score of membrane currents over time across trials; values were calculated using a 204.8 ms sliding window (n = 25 repetitions). *p < 0.01. E, Plot of the mean ± SD of the phase concentration parameter (κ) over time (computed by bootstrapping with resampled datasets matched in size to the original dataset). Dashed horizontal line indicates the threshold for significant entrainment (α = 0.01).

