Figure 7.
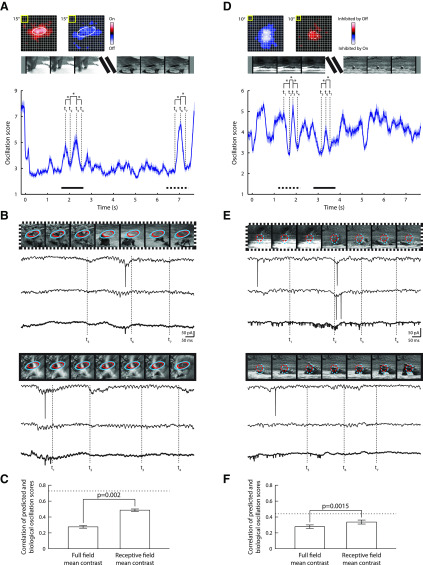
Changes in the strength of membrane oscillations during the presentation of natural scene movies in vLGN. A, On and Off maps of the receptive field of an On-Off cell and an illustration of the stimulus are shown above the oscillation score computed continuously from membrane currents recorded during the movie (n = 10 repetitions). Solid curve indicates the mean. Shading represents the SEM. The 1 s segments of the curves marked by the dotted and solid horizontal lines correspond to responses illustrated in B, as do the vertical dashed lines labeledt1-7. *p < 0.01. B, Top, Image sequences (every 10th frame of the movie) for the interval marked by the dotted line in A, with the position of the On and Off receptive field maps, indicated by overlays, shown above sample membrane currents (two individual traces with the average of all trials bolded at 2× gain). Bottom, Same as for the top panel but for the interval marked by the solid line. C, Bar plots of correlations between predicted oscillation scores (made using ridge regression analysis) and oscillation scores computed from the biological data for the mean contrast of the full field, or the mean contrast of the image patch that contained the receptive field. Error bars indicate mean ± SEM. Dashed line represents a heuristic upper bound for model performance. D–F, Same analyses for a second cell (n = 20 repetitions).

