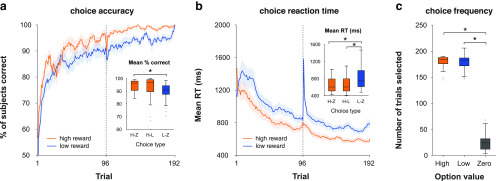
Figure 2.
Behavioral results in the reward learning task (training phase). a, Grand-average learning curves for high-reward (high vs zero, high vs low) and low-reward (low vs zero) choice trials. Dotted line indicates the boundary between sessions 1 and 2. Error shading reflects SEM. Inset, Average percentage correct as a function of choice type. The central mark within each box indicates the median, the box edges indicate the 25th and 75th percentiles, the whiskers indicate the most extreme data points not considered outliers, and the gray points indicate outliers. Asterisks indicate p < 0.05 in a paired t test. b, Grand-average trialwise reaction time. Same conventions as in a. Inset, Average reaction time as a function of choice type. Same convention as in a. c, Selection frequency as a function of stimulus value. Same conventions as in a.

