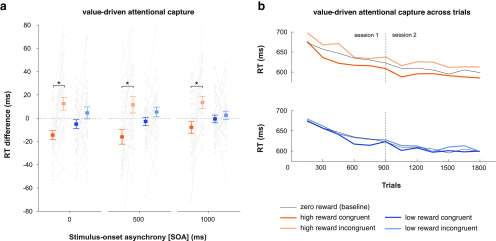
Figure 4.
Value-driven attentional capture as measured by behavior in the attention task. a, Mean RT difference scores (with baseline condition subtracted out) as a function of reward, congruency, and SOA. Gray lines indicate individual participant data. Positive and negative values indicate RTs slower and faster than baseline, respectively. Asterisks indicate p < 0.05 in a paired t test. Error bars indicate SEM. b, RTs for each condition across trials, averaged within 150-trial bins.

