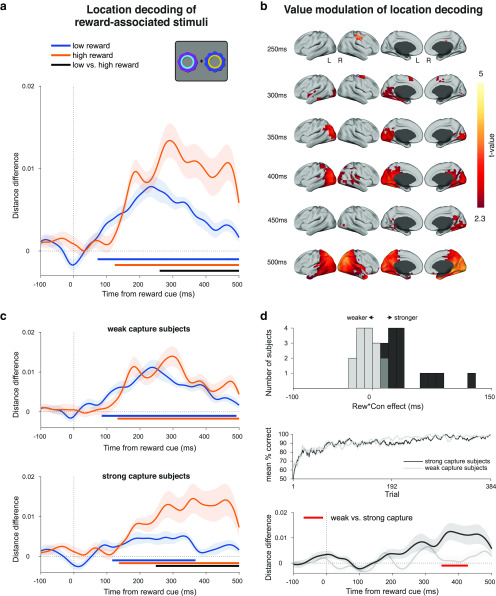
Figure 5.
Decoding reward cue location in the attention task during the cue epoch of the 500 and 1000 ms SOA conditions. a, Decoding of reward cue location during the cue epoch for high- and low-reward stimulus trials. Curves depict decoding averaged across trials and participants for high- and low-reward options. Bars indicate significant decoding (p < 0.05, cluster-based permutation test across time) for each reward condition (orange, blue bars) and between reward conditions (black bar). Shaded regions indicate SEM. b, Significant value modulation of location decoding in a source-space searchlight analysis. Maps depict t statistics at selected time points during the cue epoch, and are thresholded at p < 0.05, whole-brain cluster-corrected using TFCE. c, Same decoding as a but performing a median split on the participant-level data according to each participant's reward × congruency behavioral effect (i.e., value-modulated attentional capture effect; see Fig. 5d). Top, The “weak capture” group. Bottom, The “strong capture” group. d, Behavioral and decoding comparison of each participant group from c. Top, Histogram of participants' reward × congruency behavioral effect (weak capture in gray, strong capture in black). Middle, Learning curves for each group. Same color conventions as above. Bottom, Differences between high- and low-reward location decoding (orange minus blue lines) for each group from c. Same color conventions as above. Red bar indicates significant difference between groups (p < 0.05, independent-samples cluster-based permutation test across time).

