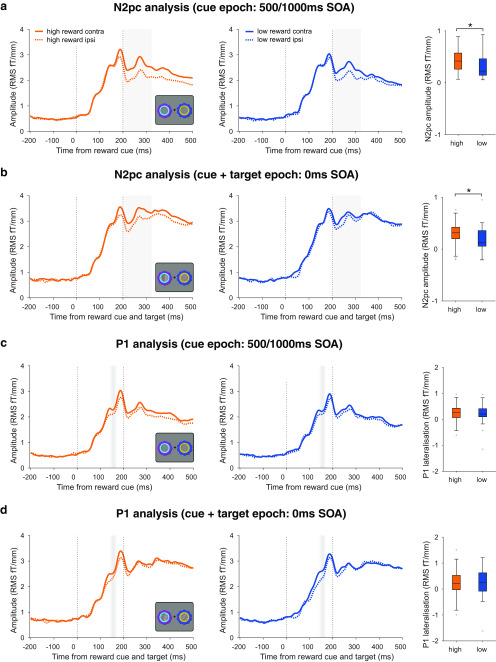
Figure 7.
Value modulation of evoked responses. a, Value modulation of the N2pc in the 500/1000 ms SOA trials. Left, middle, ERFs from combined planar gradiometer sensors contralateral and ipsilateral to the reward cues, for high- and low-reward trials (orange and blue lines) in the 500/1000 ms SOA condition. The difference between contralateral and ipsilateral lines is the N2pc. Gray shading indicates the 200–325 ms time window of interest for the analysis. Vertical dashed lines indicate reward cue onset and offset. Right, N2pc amplitude (the difference between contralateral and ipsilateral ERFs) for high- and low-reward conditions, averaged within the time window of interest indicated in gray. Asterisk indicates p < 0.05. Box plots follow the same conventions as Figure 2. b, Value modulation of the N2pc in the 0 ms SOA trials. Vertical dashed lines indicate target grating onset and target grating/cue offset. All other conventions are identical to a. c, No evidence of value modulation of the P1 in the 500/1000 ms SOA trials. Left, middle, ERFs from combined planar gradiometer sensors contralateral and ipsilateral to the reward cues, for high- and low-reward trials (orange and blue lines) in the 500/1000 ms SOA condition. Faded gray shading indicates the mean ± 1 SD of the P1 peak latency across participants (averaged across sensors). Vertical dashed lines indicate reward cue onset and offset. Right, P1 lateralization (the difference between contralateral and ipsilateral ERFs) for high- and low-reward conditions, averaged within a 50 ms window around a sensor- and subject-specific P1 peak. Box plots follow same conventions as Figure 2. d, No evidence of value modulation of the P1 in the 0 ms SOA trials. Vertical dashed lines indicate target grating onset and target grating/cue offset. All other conventions identical to those in c.

