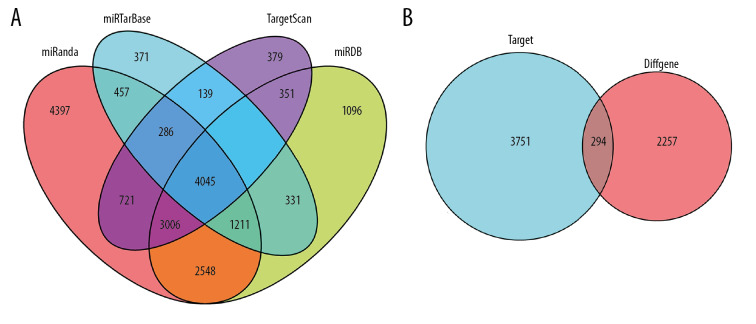
Figure 2.
Venny plot. (A) Shows the four database intersections predicting the target mRNAs. (B) Shows the Venny plot of the intersection with the differential mRNAs, which target represents the mRNAs of the intersection from the 4 databases, and diffGene represents the differentially expressed mRNAs. mRNAs – messenger RNAs.

