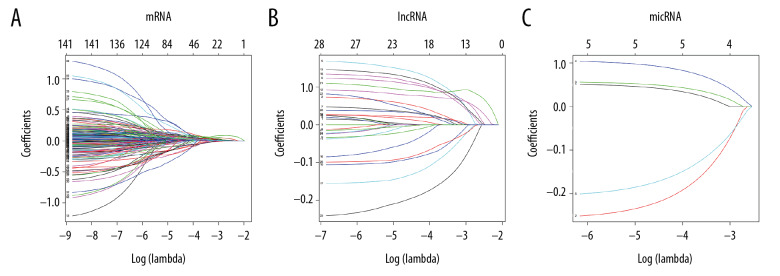
Figure 6.
Lasso regression model of RNAs in lung adenocarcinoma. (A–C) Shows Lasso regression models of mRNA, lncRNA and miRNA, respectively. Each line represents a sample. The Y-axis of the graph represents the coefficients of the sample, the top axis represents the number of samples, and the bottom axis represents the logarithm of the parameter λ (Log(lambda)). mRNA – messenger RNA, lncRNA – long noncoding RNA; miRNA – microRNA.

