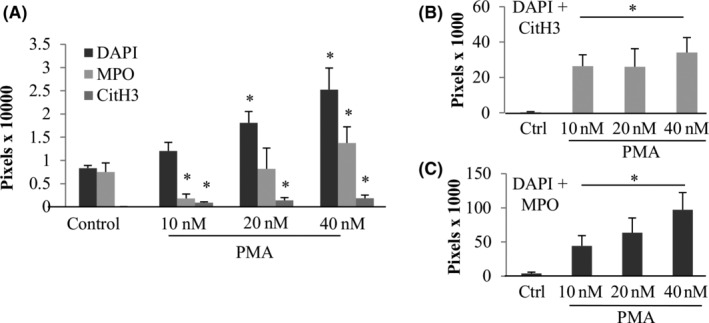
FIGURE 2.

Quantification of markers of PMA induced NETosis. Z‐stacks mages were quantified using ImageJ and each marker was averaged, A. In addition, a colocalization macro was used to quantify colocalized pixels of DAPI+CitH3, B, and DAPI+MPO (C). *Statistically different from the untreated control P < .05. Error bars represent SD. Images include three separate experiments, each in triplicate
