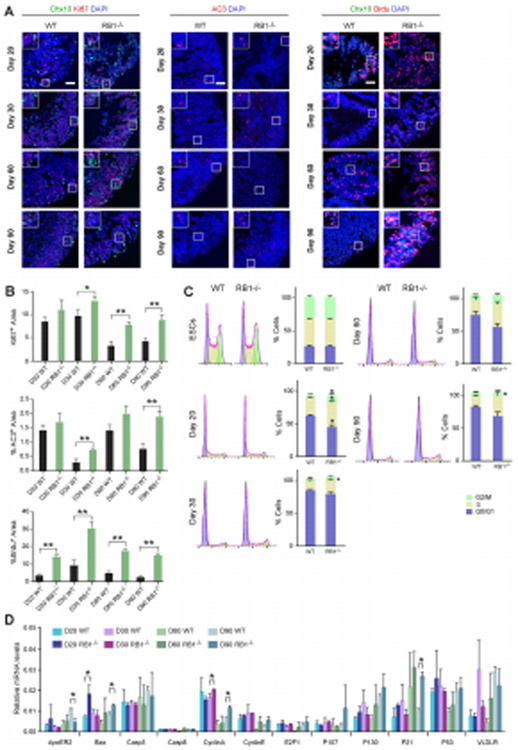
Figure 3. Loss of RB increases S-phase entry.
(A) Representative wild-type and RB1−/− organoids at D20, 30, 60 and 90 sectioned and immunostained against Ki67 and Chx10, AC3, Chx10 and Brdu; and counterstained with DAPI. (B) The graphs show the percentage of Ki67+/DAPI+ area, AC3+/DAPI+ area and Brdu+/ DAPI+ area at different time points. The results are mean±s.e.m. of 9 organoids from three independent experiments. Relative mRNA levels of RB family genes and genes involved in cell cycle regulation and apoptosis as measured by RT-qPCR. The results are mean±s.e.m. of 3 organoids from three independent experiments (*P<0.05, **P<0.01, Student’s t-test). (C) Plots on the left show representative wild-type and RB1−/− organoid cell cycle profiles at D20, 30, 60 and 90. The graphs on the right show the percentage of cells in each cell cycle phase at different time points. The results are mean±s.e.m. of 3 organoids from three independent experiments (*P<0.05, Student’s t-test). (D). Relative mRNA levels of RB related genes measured by qRT-PCR. The results are mean±s.e.m. of 3 organoids from three independent experiments (*P<0.05, Student’s t-test). Scale bars: 50 μm.

