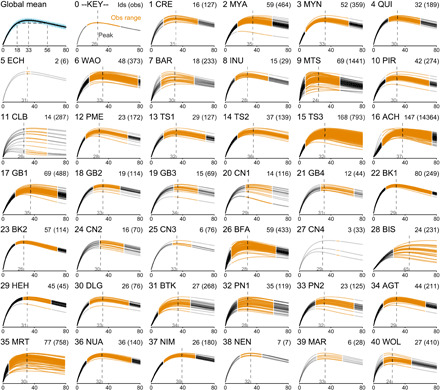
Fig. 2. Skill functions.

The figure depicts the global average of skill (top left plot) and skill at the respective study sites. Within study sites, each curve is the posterior mean skill for an individual hunter, standardized to the maximum within each site. In the header of each plot, the site number and three-letter code are shown along with the number of individual hunters in each sample, followed by the number of observed harvests in parentheses. The orange span of ages corresponds to ages observed within each site, while the gray ranges were unobserved and are instead implied by the underlying model. The vertical dashed lines show the average ages at peak within sites.
