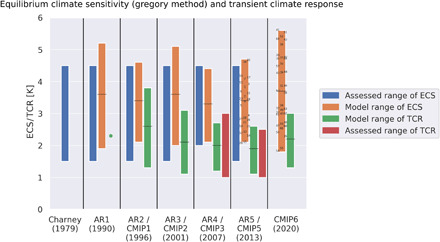
Fig. 1. Historical values of ECS and TCR.

Assessed values of ECS (blue bars) and TCR (red bars), ranges from models of ECS (orange bars), and TCR (green bars; single value from the AR1 is green dot); numbers are individual model values of ECS from CMIP5 and CMIP6 (available on the ESGF as of March 2020). The numbers denoting individual models for CMIP5 are listed in Table 1 and those for CMIP6 in Table 2. Sources for values: AR1: table 3.2a of [IPCC First Assessment Report Ch. 3 (5)]; (ECS, 19 models with variable clouds; TCR, 1 model). AR2/CMIP1: figure 6.4 and table 6.3 of [IPCC Second Assessment Report Ch. 6 (18)] (ECS, 9 models; TCR, 13 models). AR3/CMIP2: table 9.1 of [IPCC Third Assessment Report, Ch. 9 (20)] (ECS, 14 models; TCR, 19 models). AR4/CMIP3: figure 10.25 of [IPCC Fourth Assessment Report Ch. 10 (21)] (ECS and TCR, 19 models). AR5/CMIP5: figure 9.42 and table 9.5 of [IPCC Fifth Assessment Report Ch. 9 (25)] (ECS, 23 models; TCR, 30 models; this differs somewhat from currently available CMIP5 models in the ESGF in Table 1). CMIP6: ECS (37 models) and TCR (37 models), with data available from a total of 39 models on the ESGF in March 2020 (Table 2).
