
Fig. 3. ECS calculated for the CMIP6 models in Table 2 using the Gregory method over different time scales.
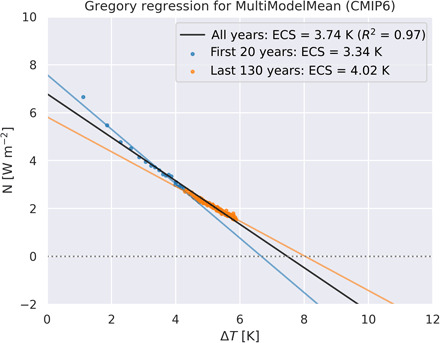
Using the entire 150-year 4xCO2 experiment (black line), there is an ECS value of 3.7°C; using only the first 20 years (blue dots and blue line), there is an ECS of 3.3°C; and using the last 130 years, there is an ECS of 4.0°C (orange dots and orange line).