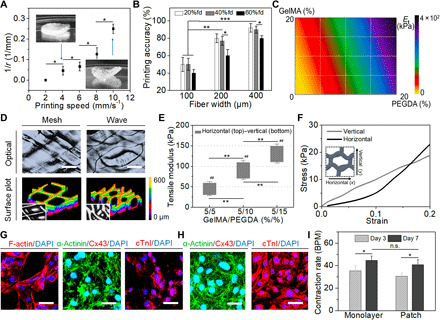
Fig. 2. Printing of smart cardiac patch and optimization.

(A) Curvature change of 4D morphing versus printing speed (means ± SD, n ≥ 6, *P < 0.05). (B) Printing accuracy of the hydrogel patches versus fiber width for different fill density (fd; means ± SD, n ≥ 6, *P < 0.05, **P < 0.01, and ***P < 0.001). (C) Color map of tensile moduli of the patches with varying GelMA and PEGDA concentrations. (D) Optical and 3D surface plot images of the patches. Scale bars, 200 μm. (E) Average elasticity values of the wave-patterned patches in horizontal (x) and vertical (y) directions. Number sign (#) shows the statistical comparison between the horizontal and vertical directions (means ± SD, n ≥ 6, **P < 0.01 and ##P < 0.01). (F) Uniaxial tensile stress-strain curves of 5% GelMA and 15% PEGDA. Immunostaining of cell morphology (F-actin; red), sarcomeric structure (α-actinin; green), gap junction [connexin 43 (Cx43); red], and contractile protein [cardiac troponin I (cTnI); red] on the patches on (G) day 1 and (H) day 7. Scale bars, 20 μm. (I) Beating rate of hiPSC-CMs on the patch and well plate on day 3 and day 7 (means ± SD, n ≥ 6, *P < 0.05; n.s. no significant difference). BPM, beats per minute. Photo credit: Haitao Cui, GWU.
