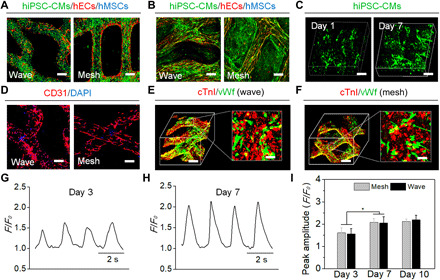
Fig. 3. In vitro characterization of the printed cellularized patches.

Cell distribution of tricultured hiPSC-CMs (green), hECs (red), and hMSCs (blue) on the cardiac patches using cell tracker staining after (A) 1 day of confluence and (B) 7 days of culture. Scale bars, 200 μm. (C) Autofluorescence 3D images of GFP+ hiPSC-CMs on the wave-patterned patch on day 1 and day 7. Scale bars, 100 μm. (D) Immunostaining of capillary-like hEC distribution (CD31; red) on the hydrogel patches. Scale bars, 200 μm. Immunostaining (3D images) of cTnI (red) and vascular protein (vWf; green) on the (E) wave-patterned and (F) mesh-patterned patches. Scale bars, 200 μm (3D image) and 20 μm (2D inset). Calcium transients of hiPSC-CMs on the hydrogel patches recorded on (G) day 3 and (H) day 7. (I) Peak amplitude of the calcium transients of hiPSC-CMs on the mesh- and wave-patterned patches on day 3, day 7, and day 10 (means ± SD, n ≥ 30 cells, *P < 0.05).
