Figure 3.

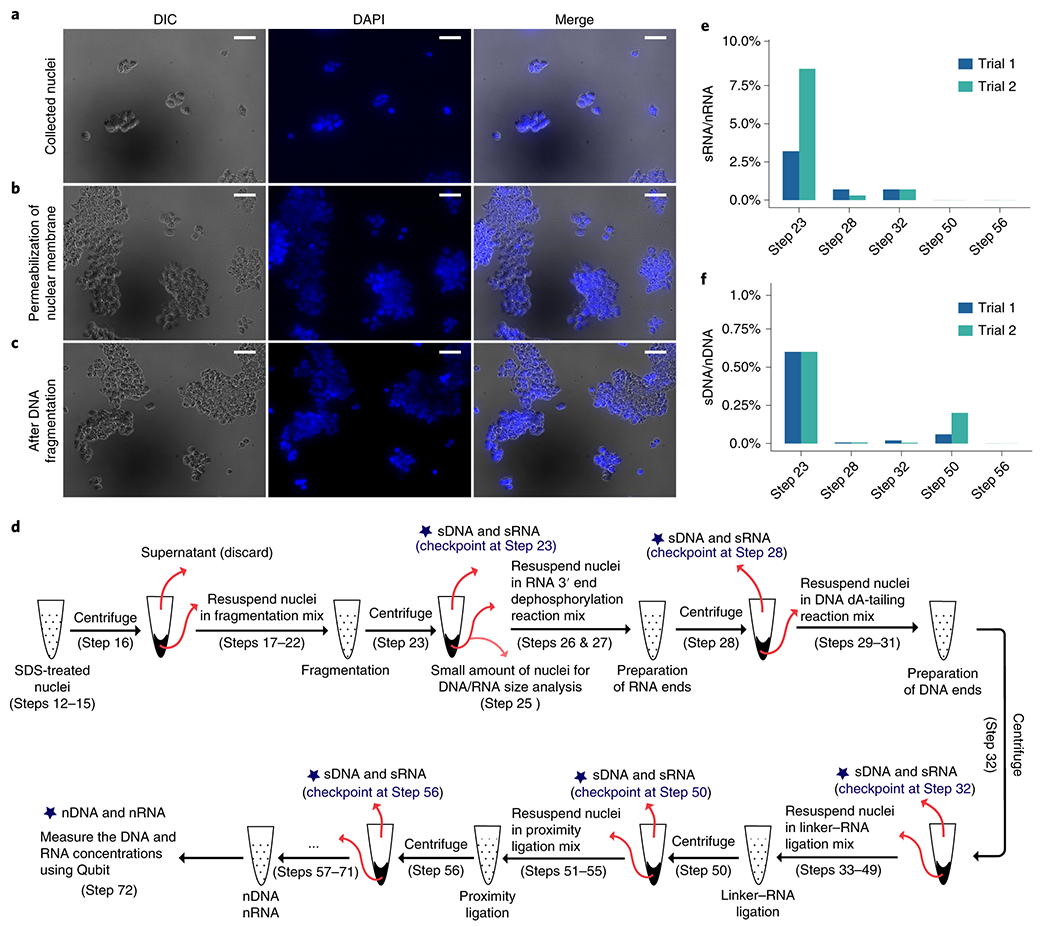
Checkpoints for nuclear integrity, (a-c) Image-based checkpoints (Box 1). DAPI staining (blue) and DIC images (grey) were taken after collection of nuclei (Step 9) (a), permeabilization of nuclear membrane (Step 17) (b), and DNA fragmentation (Step 23) (c). Confined DAPI staining in DIC defined nuclei is an indication of non-leaking nuclei. Scale bar: 50 μm. (d-f) Quantitative assessment of nuclear integrity (Box 2). (d) A schematic view of the experimental steps where supernatant RNA (sRNA) and supernatant DNA (sDNA) are quantified. Nuclear RNA (nRNA) and nuclear DNA (nDNA) are quantified at Step 72. (e) Ratios (y axis) between the amount of sRNA at each step (x axis) to the amount of nRNA measured at Step 72. (f) Ratios (y axis) between the amount of sDNA at each step (x axis) to the amount of nDNA measured at Step 72. Trials 1 and 2 are two separate experiments that start with approximately 5 million and 3 million HEK293T cells, respectively. The HEK293T cell line used in panels in this figure has been authenticated and tested to ensure its identity and that it is free from mycoplasma contamination.
