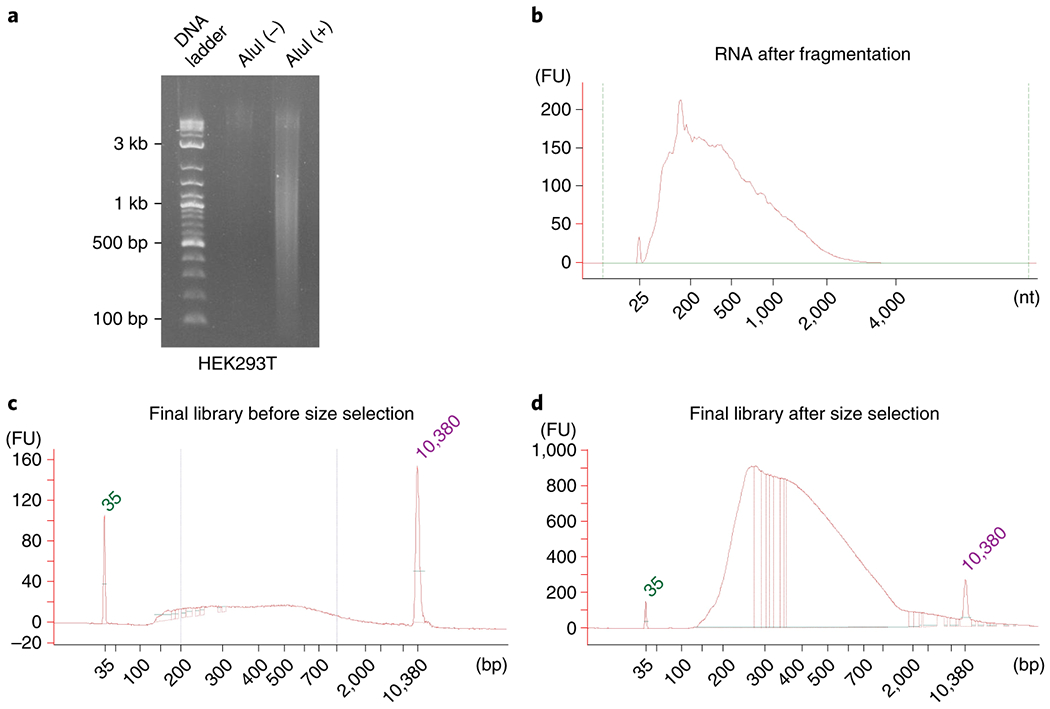
Figure 4.

Size distributions of intermediate and final products from HEK293T cells. (a) Size distributions of un-fragmented (Alul (−)) and fragmented DNA (Alul (+)) resolved on a precast 1 % (wt/vol) agarose E-gel. 2-log DNA ladder was used in as ladder, (b) Size distribution of fragmented RNA resolved on an Agilent Bioanalyzer, (c-d) Size distributions of iMARGI sequencing library before (c) and after (d) size selection. The peaks at 35 and 10,380 bp are size markers which are not included in the sequencing library. The two vertical bars indicate 200 bp and 1,000 bp, respectively.
