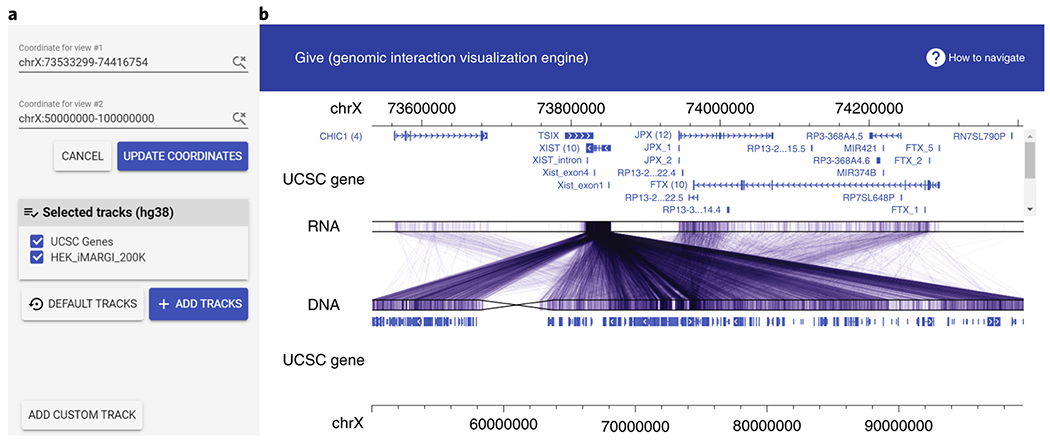
Figure 6.

Visualization of iMARGI data in GIVE, (a) User defined genome coordinates and data tracks, (b) A two-layer presentation of the genome. Every line corresponds to a mapped read pair, where the RNA end is mapped to the top layer (RNA lane) and the DNA end is mapped to the bottom layer (DNA lane). Users can adjust the coordinates of the two layers separately using the input box in the left panel. The current setting shows human Chromosome X: 73,533,299 – 74,416754 in the top layer, covering the XIST gene and its genomic neighborhood, and Chromosome X: 50,000,000 – 100,000,000 in the bottom layer, covering 50 Mb of the X chromosome.
