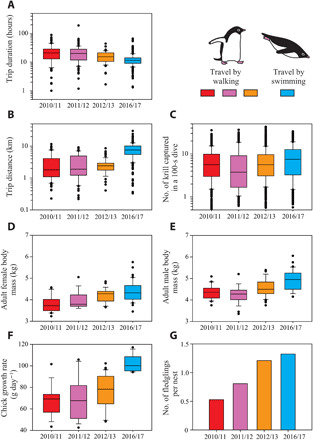
Fig. 2. Interannual variability in penguin performance.

(A) Trip duration, (B) trip distance (i.e., the maximum distance from nests reached during the trips), and (C) the number of krill captured in a dive, standardized for a 100-s dive duration, plotted on a log scale. Body mass of adult (D) females and (E) males, (F) chick growth rates, and (G) the number of fledglings per nest, plotted on a linear scale. In box plots, the 25th percentile, the median, and the 75th percentile are shown by boxes, the 10th and 90th percentiles are shown by error bars, and the data points outside the 10th and 90th percentiles are shown by small circles.
