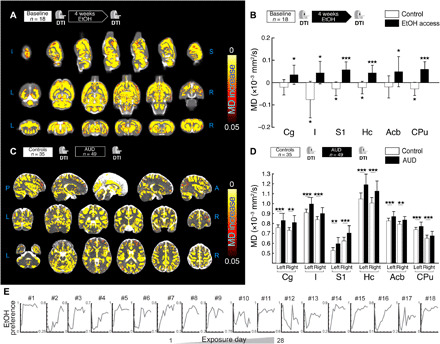
Fig. 1. Effects of alcohol consumption in MD for rats and humans.

(A) Voxel-wise statistical analysis showing longitudinal MD differences between rats at baseline and after 4 weeks of alcohol drinking. (B) Mean MD change versus baseline in six gray matter regions of interest (ROIs) for alcohol-drinking and control msP rats. Reported post hoc statistic shows significant differences between alcohol and baseline, as well as a significant age effect in the control group. (C) Voxel-wise statistical analysis showing cross-sectional MD differences between controls and alcohol-dependent patients at first scan. (D) Mean MD values in selected ROIs for controls and patients with AUD at first scan. Reported statistics show cross-sectional differences between controls and patients with AUD. For all panels, *P < 0.05, **P < 0.01, and ***P < 0.001. (E) Individual EtOH preference, measured as the ratio of EtOH/water-drinking amount, plotted as a function of the exposure day (from 1 to 28 days) in one batch of representative animals. Cg, cingulate cortex; I, insular cortex; S1, primary somatosensory cortex; Hc, hippocampus; Acb, accumbens; CPu, caudate-putamen.
