
Fig. 2. Alcohol alters the ECS geometry.
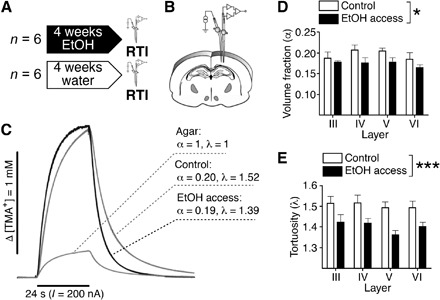
(A) Experimental design. (B) Scheme illustrating the arrangement of electrodes in a typical experiment. (C) Representative diffusion curves and their parameters obtained in vivo in the cortical layer V of a control and an alcohol-exposed rat or in the diluted agar. (D) Quantification of volume fraction (α) in control (white) and alcohol-exposed (black) msP rats. A slightly significant effect of alcohol was found by two-way ANOVA [F(1,38) = 6.7, P < 0.05]. No effects of cortical layer or interaction between alcohol treatment and cortical layer were found. (E) Quantification of tortuosity (λ) in control (white) and alcohol-exposed (black) msP rats. A robust significant effect of alcohol was found by two-way ANOVA [F(1,38) = 21.6, P < 0.0001]. No effects of cortical layer or interaction were found. For all panels, *P < 0.05 and ***P < 0.001.