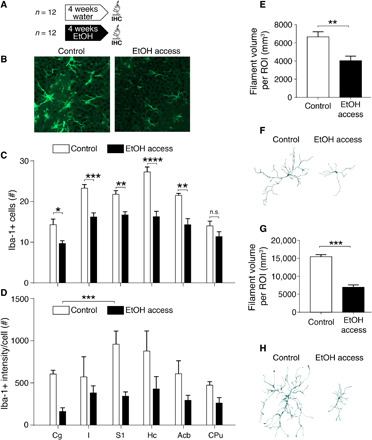
Fig. 3. Microglial response to alcohol drinking.

(A) Experimental design. IHC, immunohistochemistry. (B) Iba-1–positive (Iba-1+) immunostaining in histological sections from representative animals in the two experimental groups. Images were taken from the hippocampal formation (dentate gyrus). (C) Quantification of Iba-1+ cell numbers under control conditions (white) and after 1-month drinking (black). A robust significant effect of the experimental group was found by two-way ANOVA [F(1,40) = 97.7, P < 0.0001] and a significant interaction between factors [F(5,40) = 3.5, P = 0.01]. (D) Same as (C) but for staining intensity. A robust significant effect of the experimental group was found by two-way ANOVA [F(1,34) = 34.2, P < 0.0001]. No interaction was found [F(5,34) = 1.11, P = 0.38]. (E) Morphological analysis of 56 microglia cells in the nucleus accumbens, showing a reduced filament volume per ROI under EtOH conditions (unpaired t test, t = 6.1, df = 5, P = 0.0017). (F) Example of reconstructed microglia cells under the two conditions in the nucleus accumbens. (G) Morphological analysis of 56 microglia cells in the hippocampus, showing a reduced filament volume per ROI under EtOH conditions (unpaired t test, t = 14.8, df = 3, P = 0.0007). (H) Example of reconstructed microglia cells under the two conditions in the hippocampus. For all panels, *P < 0.05, **P < 0.01, and ***P < 0.001.
