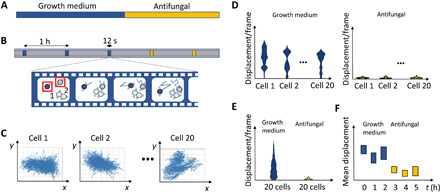
Fig. 1. Overview of the optical nanomotion method to detect cellular nanomotions.

(A) Time period of cells in growth medium followed by, e.g., an antifungal treatment. (B) At different time points, movies are recorded of 1000 frames. Cell movements within the box are detected and analyzed. (C) The x-y displacements of individual cells (typically 20 cells) are calculated using the cross-correlation algorithm. (D) For each cell, the displacement per frame is calculated, and this distribution is represented by a combined violin and box plot. (E) The displacement per frame for all cells for a condition/sampling point is represented as a combined violin plot and box plot. (F) The mean of the total displacements of 20 cells is calculated for each condition/sampling point and represented in a box plot.
