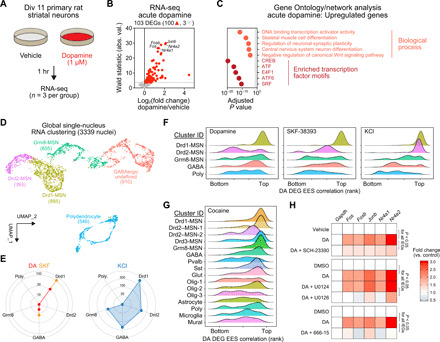
Fig. 4. Identification of a cell type–specific DA-mediated transcriptional program.

(A) Experimental setup for modeling DA receptor activation in striatal cultures. (B) Volcano plot showing DEGs following 1 hour. DA treatment, including three down-regulated genes (light gray) and 100 up-regulated genes (red). (C) Top five significant biological processes (Gene Ontology) and transcription factor binding site enrichment (motif analysis) for 100 up-regulated DA DEGs. A maximum value was assigned to CREB (adjusted P = 0). (D) snRNA-seq from 3339 nuclei identified five major cell classes in primary striatal neuron cultures. Neurons were treated with DA (50 μM), the DRD1 agonist SKF-38393 (1 μM) or depolarized with 25 mM KCl. (E) DEG number by cell cluster. (F) Ridgeline plots showing density of EES-gene correlation ranks for core DA signature genes [100 up-regulated genes from (B)]. (G) DA signature gene induction in multiple MSN clusters following acute cocaine experience in vivo (clusters from Fig. 1B). (H) Quantitative reverse transcription polymerase chain reaction (RT-qPCR) for representative DA response genes following cotreatment with DRD1 receptor antagonist SCH-23390 (1 μM), MAPK kinase (MEK) inhibitor (U0126, 1 μM), or CREB inhibitor (666-15, 1 μM). P < 0.05 for DA IEGs (n = 7 to 12 per group).
