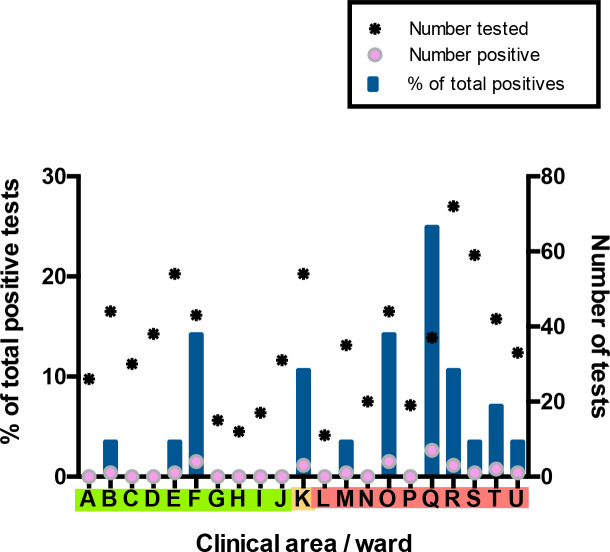
Figure 3. Distribution of SARS-CoV-2 positive cases across 21 clinical areas, detected by ward-based asymptomatic screening.
(underlying data shown in ‘Source Data’). Wards are coloured (‘green’, ‘amber’, ‘red’) according to risk of anticipated exposure to COVID-19 (Table 4). HCWs working across >1 ward were counted for each area. The left-hand y-axis shows the percentage of positive results from a given ward compared to the total positive results from the HCW asymptomatic screening group (blue bars). The right-hand y-axis shows the total number of SARS-CoV-2 tests (stars) and the number positive (pink circles). Additional asymptomatic screening tests were subsequently performed in an intensified manner on ward F and ward Q after identification of clusters of positive cases on these wards (Figure 4). Asymptomatic screening tests were also performed for a number of individuals from other clinical areas on an opportunistic basis; none of these individuals tested positive. Results of these additional tests are included in summary totals in Table 1, but not in this figure.

